look at these dot plots. which statement is true about the two data sets?\nboth have the same mode.\nboth…
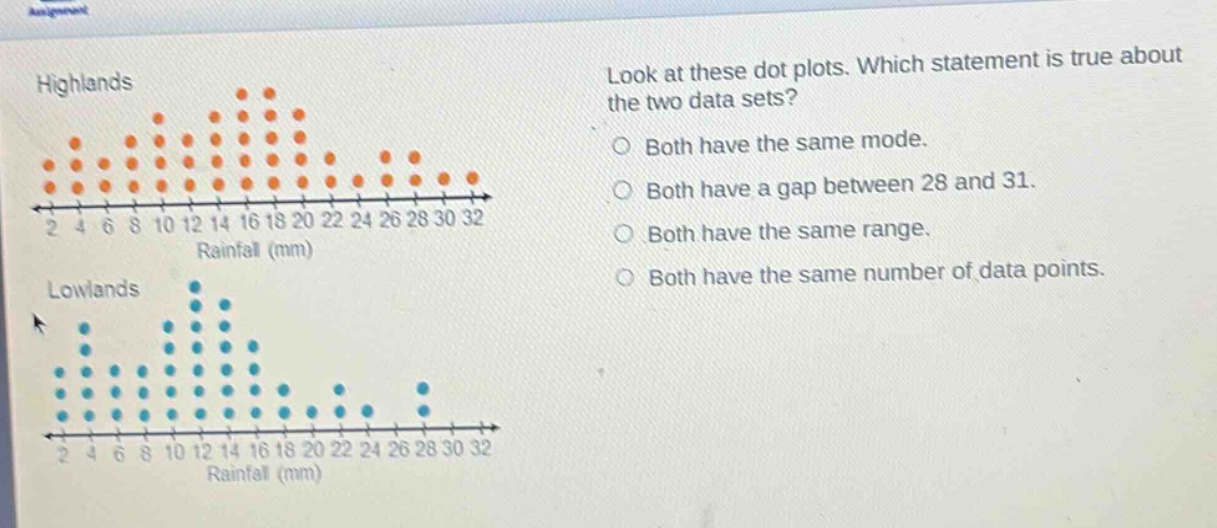
look at these dot plots. which statement is true about the two data sets?\nboth have the same mode.\nboth have a gap between 28 and 31.\nboth have the same range.\nboth have the same number of data points.
Answer
Explanation:
Step1: Find the mode of each data - set
The mode is the value with the highest frequency. For the Highlands, the mode is around 16 - 18. For the Lowlands, the mode is around 12. So, they don't have the same mode.
Step2: Check for gaps
In the Highlands, there is no gap between 28 and 31. In the Lowlands, there is a gap between 28 and 31. So, this statement is false.
Step3: Calculate the range
The range is the difference between the maximum and minimum values. For the Highlands, the minimum is 2 and the maximum is 32, so the range is (32 - 2=30). For the Lowlands, the minimum is 2 and the maximum is 32, so the range is (32 - 2 = 30). They have the same range.
Step4: Count the number of data - points
Counting the dots, the Highlands have a different number of data - points than the Lowlands.
Answer:
Both have the same range.