look at this scatter plot. complete these sentences about the lines in the graph. line m is not a good fit…
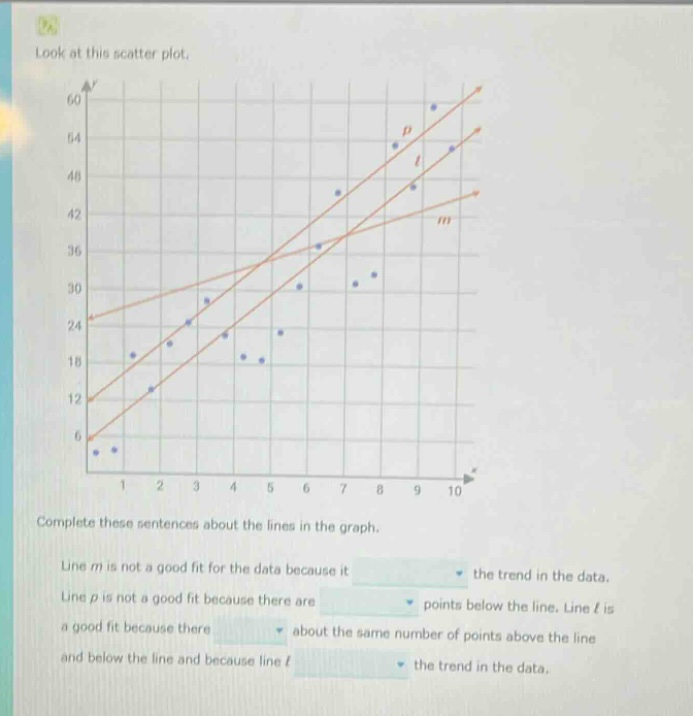
look at this scatter plot. complete these sentences about the lines in the graph. line m is not a good fit for the data because it the trend in the data. line p is not a good fit because there are points below the line. line l is a good fit because there about the same number of points above the line and below the line and because line l the trend in the data.
Answer
Explanation:
Step1: Analyze line m
Line m does not follow the general upward - sloping trend of the data points. So, it does not follow the trend in the data.
Step2: Analyze line p
By observing the scatter - plot, there are more points below line p than above it.
Step3: Analyze line l
Line l has about the same number of points above and below it and also follows the upward - sloping trend of the data.
Answer:
Line m is not a good fit for the data because it does not follow the trend in the data. Line p is not a good fit because there are more points below the line. Line l is a good fit because there are about the same number of points above the line and below the line and because line l follows the trend in the data.