lydia runs an experiment to determine if a coin is fair by counting the number of times a coin lands heads…
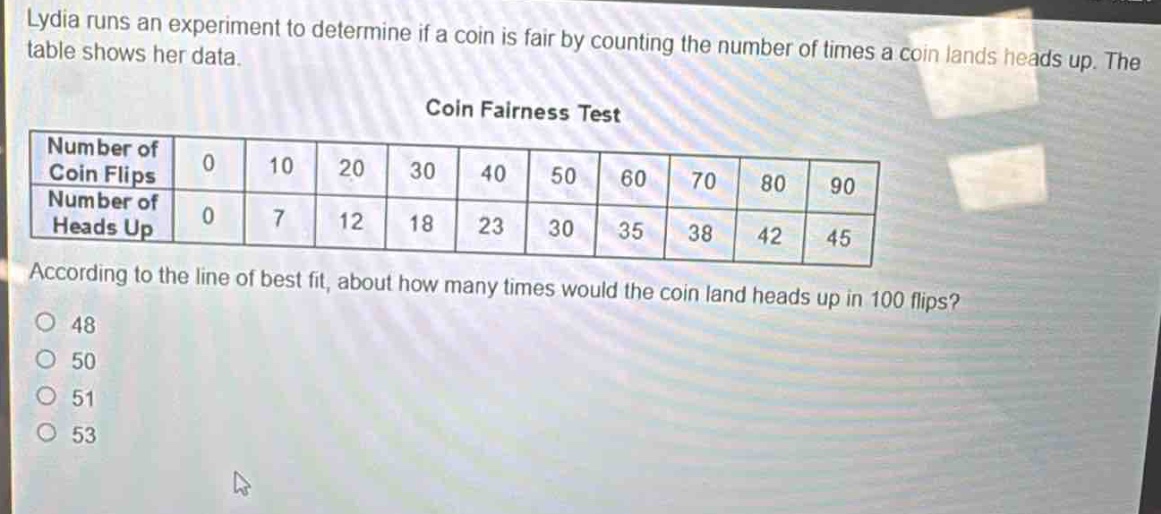
lydia runs an experiment to determine if a coin is fair by counting the number of times a coin lands heads up. the table shows her data.\ncoin fairness test\n|number of coin flips|0|10|20|30|40|50|60|70|80|90|\n|number of heads up|0|7|12|18|23|30|35|38|42|45|\naccording to the line of best fit, about how many times would the coin land heads up in 100 flips?\no 48\no 50\no 51\no 53
Answer
Explanation:
Step1: Find the trend
We can observe that as the number of coin - flips increases, the number of heads - up also increases in a somewhat linear fashion. We can calculate the ratio of heads - up to coin - flips for each data point and see the trend. For example, for 10 flips, the ratio is $\frac{7}{10}=0.7$, for 20 flips, $\frac{12}{20} = 0.6$, for 30 flips, $\frac{18}{30}=0.6$, for 40 flips, $\frac{23}{40}=0.575$, for 50 flips, $\frac{30}{50}=0.6$, for 60 flips, $\frac{35}{60}\approx0.583$, for 70 flips, $\frac{38}{70}\approx0.543$, for 80 flips, $\frac{42}{80}=0.525$, for 90 flips, $\frac{45}{90}=0.5$.
Step2: Estimate for 100 flips
As the number of flips increases, the ratio seems to be approaching 0.5. For a fair coin, the probability of getting heads is 0.5. So, for 100 flips, the expected number of heads is $100\times0.5 = 50$.
Answer:
50