lynn wants to predict how much fuel her car will use based on its speed. she drove a car 100 km at each of…
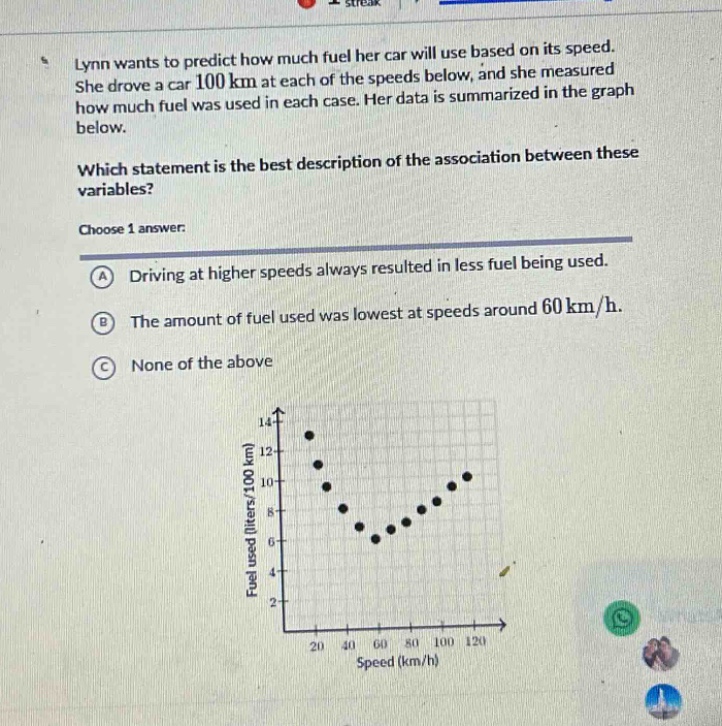
lynn wants to predict how much fuel her car will use based on its speed. she drove a car 100 km at each of the speeds below, and she measured how much fuel was used in each case. her data is summarized in the graph below. which statement is the best description of the association between these variables? choose 1 answer: a driving at higher speeds always resulted in less fuel being used. b the amount of fuel used was lowest at speeds around 60 km/h. c none of the above
Answer
Brief Explanations:
By observing the graph, we can see that the fuel - use (liters/100 km) first decreases as speed increases from 20 km/h, reaches a minimum around 60 km/h, and then increases as the speed continues to rise. Option A is incorrect because higher speeds do not always result in less fuel being used. Option B is correct as the graph shows the lowest fuel - use value around 60 km/h.
Answer:
B. The amount of fuel used was lowest at speeds around 60 km/h.