a machine at a bakery contains flour. when the machine is turned on, it begins to pour the flour out. the…
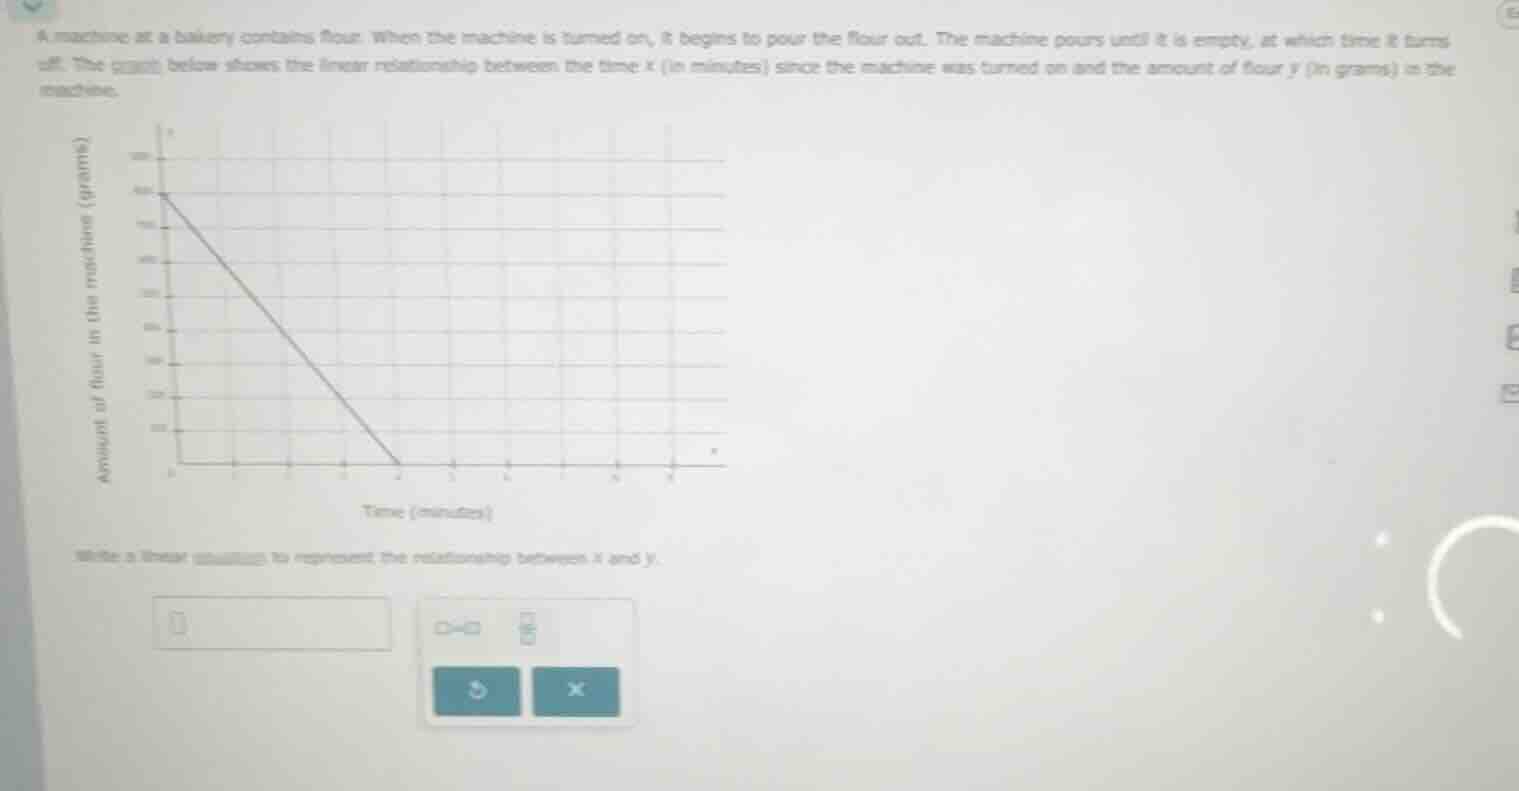
a machine at a bakery contains flour. when the machine is turned on, it begins to pour the flour out. the machine pours until it is empty, at which time it turns off. the graph below shows the linear relationship between the time x (in minutes) since the machine was turned on and the amount of flour y (in grams) in the machine.\n\nwrite a linear equation to represent the relationship between x and y.
Answer
Explanation:
Step1: Identify intercepts
The y-intercept (when $x=0$) is $y=600$, so the initial flour amount is 600 grams. The x-intercept (when $y=0$) is $x=4$, meaning the machine empties in 4 minutes.
Step2: Calculate slope
Slope $m$ is change in $y$ over change in $x$: $$m = \frac{0 - 600}{4 - 0} = -150$$
Step3: Write linear equation
Use slope-intercept form $y = mx + b$, where $b=600$ and $m=-150$: $$y = -150x + 600$$
Answer:
$y = -150x + 600$