is the magnitude of an earthquake related to the depth below the surface at which the quake occurs? let x be…
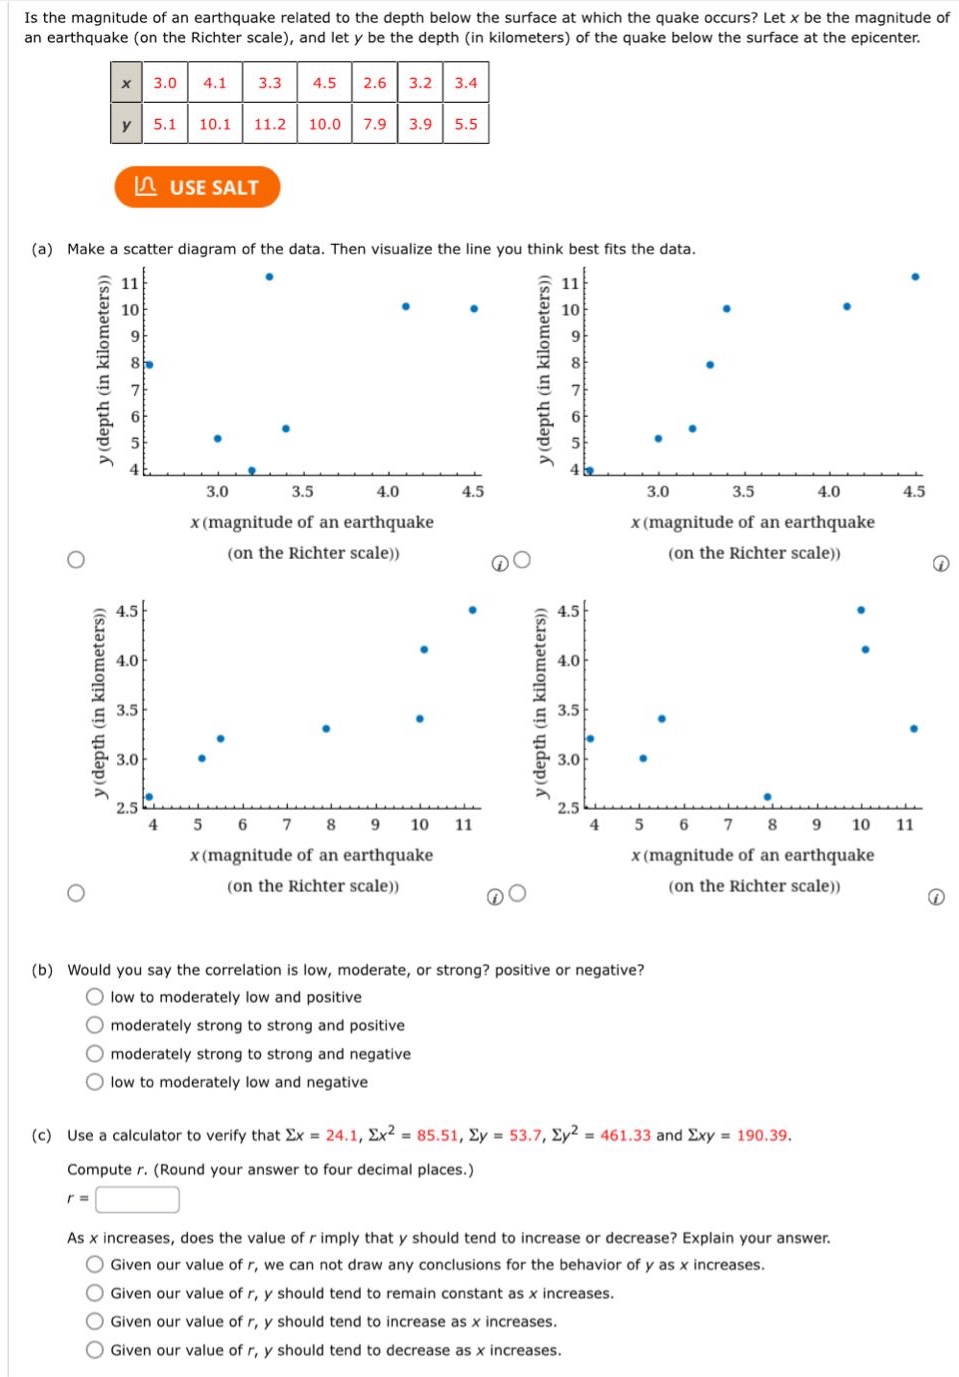
is the magnitude of an earthquake related to the depth below the surface at which the quake occurs? let x be the magnitude of an earthquake (on the richter scale), and let y be the depth (in kilometers) of the quake below the surface at the epicenter.\n|x|3.0|4.1|3.3|4.5|2.6|3.2|3.4|\n|y|5.1|10.1|11.2|10.0|7.9|3.9|5.5|\n(a) make a scatter diagram of the data. then visualize the line you think best fits the data.\n(b) would you say the correlation is low, moderate, or strong? positive or negative?\nlow to moderately low and positive\nmoderately strong to strong and positive\nmoderately strong to strong and negative\nlow to moderately low and negative\n(c) use a calculator to verify that σx = 24.1, σx² = 85.51, σy = 53.7, σy² = 461.33 and σxy = 190.39.\ncompute r. (round your answer to four decimal places.)\nr =\nas x increases, does the value of r imply that y should tend to increase or decrease? explain your answer.\ngiven our value of r, we can not draw any conclusions for the behavior of y as x increases.\ngiven our value of r, y should tend to remain constant as x increases.\ngiven our value of r, y should tend to increase as x increases.\ngiven our value of r, y should tend to decrease as x increases.
Answer
Explanation:
Step1: Recall the correlation - coefficient formula
The formula for the sample correlation coefficient $r$ is $r=\frac{n\sum xy-(\sum x)(\sum y)}{\sqrt{[n\sum x^{2}-(\sum x)^{2}][n\sum y^{2}-(\sum y)^{2}]}}$, where $n = 7$ (the number of data - points).
Step2: Identify the given sums
We are given $\sum x = 24.1$, $\sum x^{2}=85.51$, $\sum y = 53.7$, $\sum y^{2}=461.33$, and $\sum xy = 190.39$, and $n = 7$.
Step3: Calculate the numerator
$n\sum xy-(\sum x)(\sum y)=7\times190.39 - 24.1\times53.7=1332.73-1294.17 = 38.56$.
Step4: Calculate the first part of the denominator
$n\sum x^{2}-(\sum x)^{2}=7\times85.51-(24.1)^{2}=598.57 - 580.81=17.76$.
Step5: Calculate the second part of the denominator
$n\sum y^{2}-(\sum y)^{2}=7\times461.33-(53.7)^{2}=3229.31 - 2883.69 = 345.62$.
Step6: Calculate the denominator
$\sqrt{(n\sum x^{2}-(\sum x)^{2})(n\sum y^{2}-(\sum y)^{2})}=\sqrt{17.76\times345.62}=\sqrt{6138.2112}\approx78.3468$.
Step7: Calculate $r$
$r=\frac{38.56}{78.3468}\approx0.4922$.
Since $r\approx0.4922$, the correlation is low to moderately low and positive.
Answer:
(b) low to moderately low and positive (c) $r = 0.4922$; Given our value of $r$, $y$ should tend to increase as $x$ increases.