makani tracked the number of snow days each year at chalden middle school. which of these best describes the…
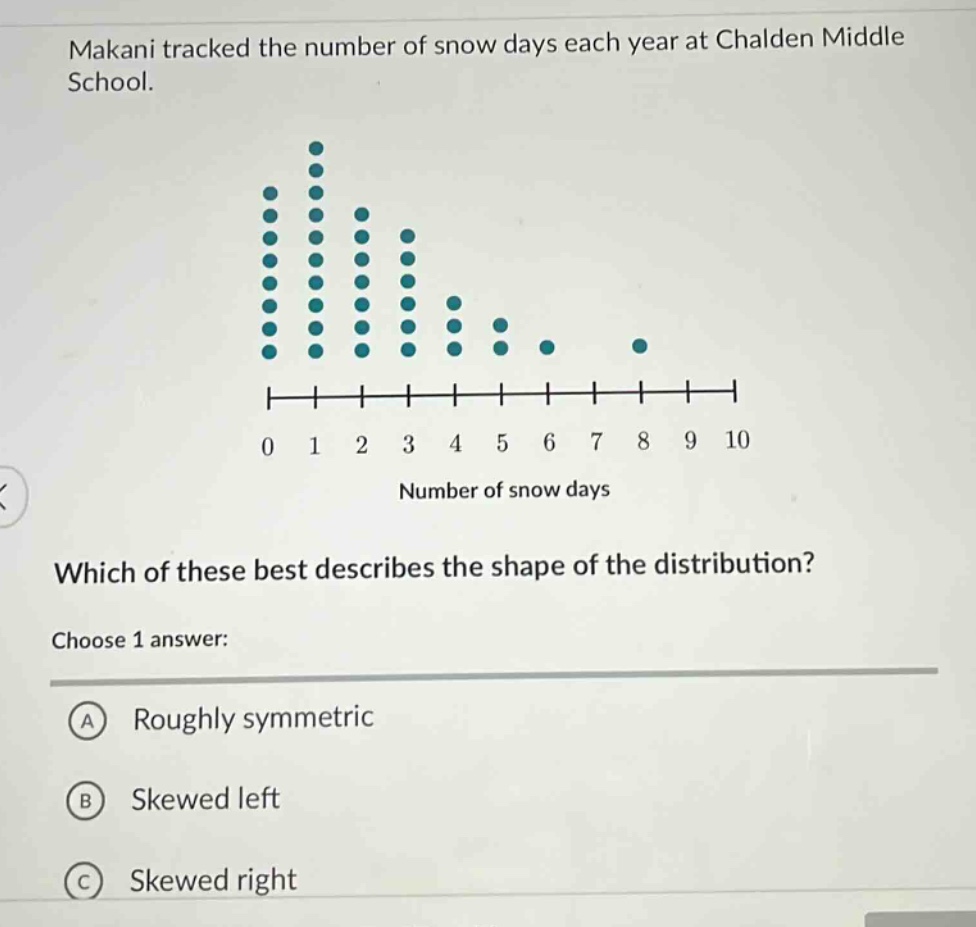
makani tracked the number of snow days each year at chalden middle school. which of these best describes the shape of the distribution? choose 1 answer: a roughly symmetric b skewed left c skewed right
Answer
Explanation:
Step1: Observe data distribution on the dot - plot
The dot - plot shows more data points clustered on the left side (lower number of snow days: 0 - 3) and the number of data points decreases as the number of snow days increases towards the right side (4 - 10).
Step2: Determine the skewness
In a skewed right distribution, the tail is on the right side. Here, the fewer data points on the right (higher snow days) form a tail to the right, which is characteristic of a skewed right distribution.
Answer:
C. Skewed right