a manager recorded how many hours each of 11 cashiers worked in a week. heres a histogram showing their…
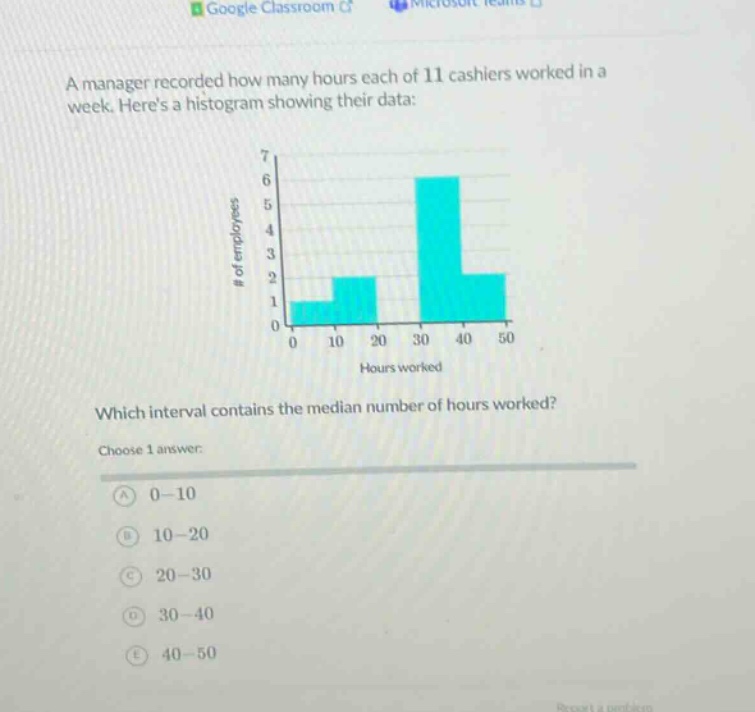
a manager recorded how many hours each of 11 cashiers worked in a week. heres a histogram showing their data: which interval contains the median number of hours worked? choose 1 answer: a 0 - 10 b 10 - 20 c 20 - 30 d 30 - 40 e 40 - 50
Answer
Explanation:
Step1: Find the total number of data - points
There are 11 cashiers, so (n = 11).
Step2: Calculate the position of the median
For a set of (n) data - points (where (n) is odd), the median is at the (\left(\frac{n + 1}{2}\right))-th position. So, (\frac{11+1}{2}=6)th position.
Step3: Cumulative frequency calculation
The first bar ((0 - 10)) has 1 employee. The second bar ((10 - 20)) has 2 employees. The cumulative frequency up to the (10 - 20) interval is (1+2 = 3). The third bar ((20 - 30)) has 0 employees. The fourth bar ((30 - 40)) has 6 employees. The cumulative frequency up to the (30 - 40) interval is (1 + 2+0 + 6=9). Since the 6th value falls within the (30 - 40) interval.
Answer:
D. (30 - 40)