the manufacturer of a soccer ball claims that only 3% of the soccer balls produced are faulty. an employee…
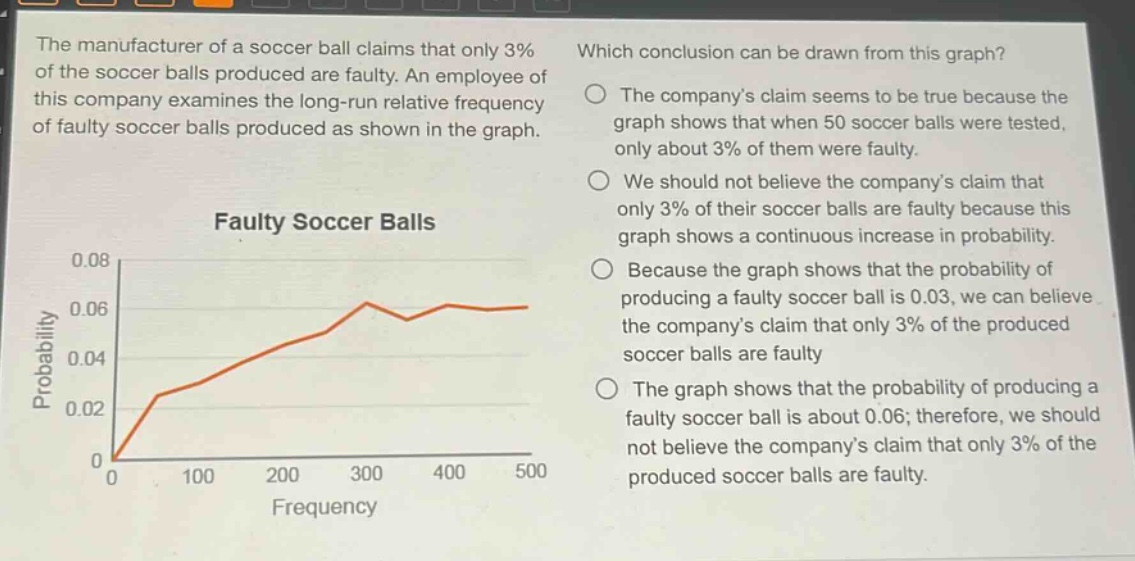
the manufacturer of a soccer ball claims that only 3% of the soccer balls produced are faulty. an employee of this company examines the long - run relative frequency of faulty soccer balls produced as shown in the graph.\n\nfaulty soccer balls\n\nwhich conclusion can be drawn from this graph?\nthe company’s claim seems to be true because the graph shows that when 50 soccer balls were tested, only about 3% of them were faulty.\nwe should not believe the company’s claim that only 3% of their soccer balls are faulty because this graph shows a continuous increase in probability.\nbecause the graph shows that the probability of producing a faulty soccer ball is 0.03, we can believe the company’s claim that only 3% of the produced soccer balls are faulty\nthe graph shows that the probability of producing a faulty soccer ball is about 0.06; therefore, we should not believe the company’s claim that only 3% of the produced soccer balls are faulty.
Answer
Explanation:
Step1: Analyze the graph
The graph shows the probability of faulty soccer - balls as the frequency of testing increases. The probability seems to stabilize around 0.06.
Step2: Compare with the company's claim
The company claims that only 3% (or 0.03) of the soccer - balls are faulty. Since the graph shows a probability of about 0.06 for faulty soccer - balls, the company's claim is not supported.
Answer:
The graph shows that the probability of producing a faulty soccer ball is about 0.06; therefore, we should not believe the company’s claim that only 3% of the produced soccer balls are faulty.