marie made the box plot below to display a set of data. which set of data could the box plot represent? 0…
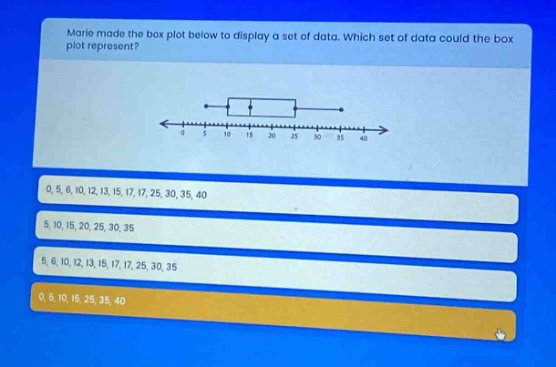
marie made the box plot below to display a set of data. which set of data could the box plot represent? 0, 5, 6, 10, 12, 13, 15, 17, 17, 25, 30, 35, 40 5, 10, 15, 20, 25, 30, 35 5, 6, 10, 12, 13, 15, 17, 17, 25, 30, 35 0, 5, 10, 15, 25, 35, 40
Answer
Explanation:
Step1: Find the minimum value
The minimum value of the box - plot is (0).
Step2: Check the minimum value in each data set
- For the data set (0,5,6,10,12,13,15,17,17,25,30,35,40), the minimum is (0).
- For the data set (5,10,15,20,25,30,35), the minimum is (5).
- For the data set (5,6,10,12,13,15,17,17,25,30,35), the minimum is (5).
- For the data set (0,5,10,15,25,35,40), the number of data points is (7). A box - plot is based on the five - number summary (minimum, first quartile (Q_1), median, third quartile (Q_3), maximum). For (n = 7) data points, the median is the (\left(\frac{n + 1}{2}\right))th value. Here (\frac{7+1}{2}=4)th value. But the box - plot structure (with the box and whiskers) is more consistent with a data set having (n\geq5) (a more "spread - out" set in terms of quartiles). The first data set (0,5,6,10,12,13,15,17,17,25,30,35,40) has (n = 13) data points.
Answer:
(0,5,6,10,12,13,15,17,17,25,30,35,40)