marie made the box plot below to display a set of data. which set of data could the box plot represent? 5…
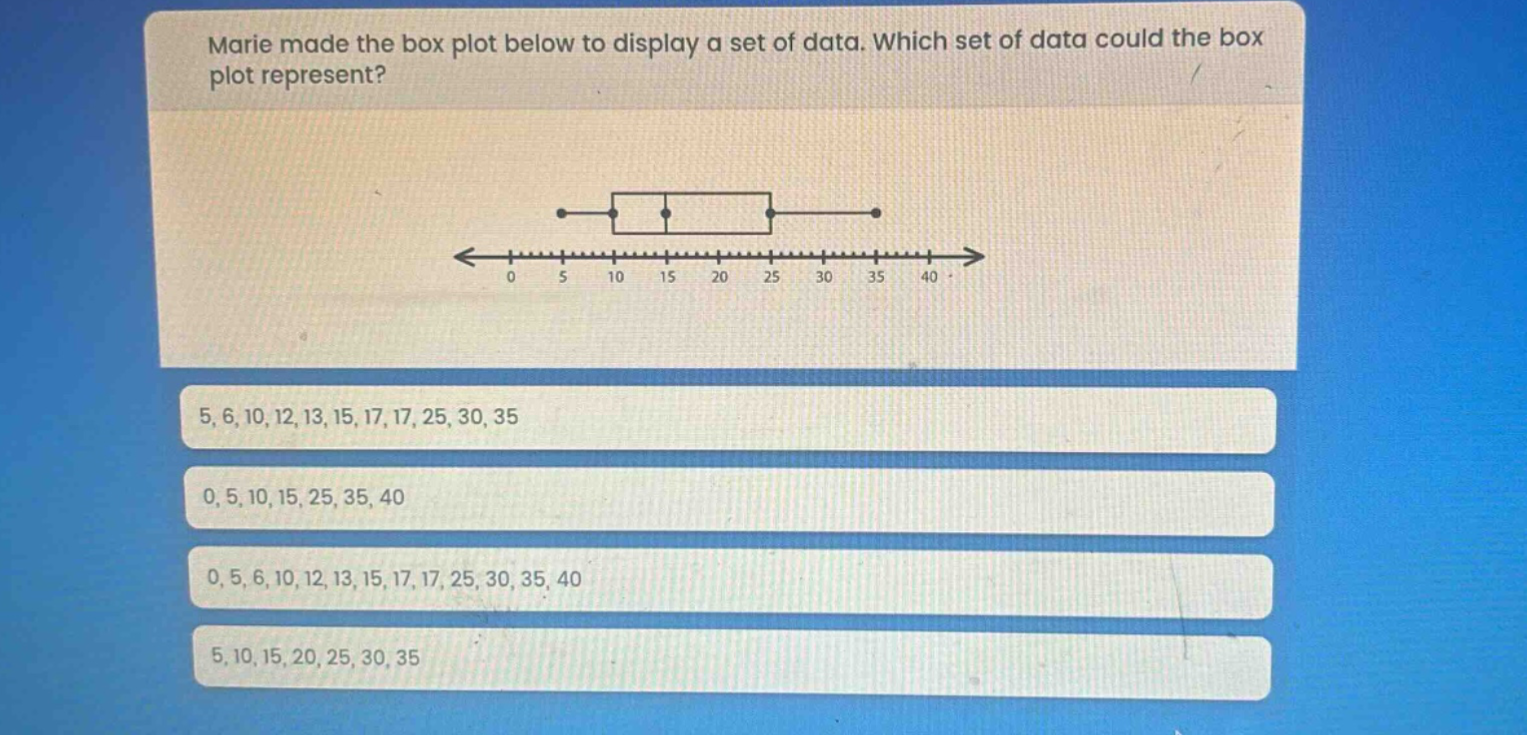
marie made the box plot below to display a set of data. which set of data could the box plot represent? 5, 6, 10, 12, 13, 15, 17, 17, 25, 30, 35 0, 5, 10, 15, 25, 35, 40 0, 5, 6, 10, 12, 13, 15, 17, 17, 25, 30, 35, 40 5, 10, 15, 20, 25, 30, 35
Answer
Explanation:
Step1: Identify box - plot features
The box - plot shows minimum value around 5, Q1 around 15, median around 20, Q3 around 25, and maximum around 35.
Step2: Check each data - set
For the data - set 5, 6, 10, 12, 13, 15, 17, 17, 25, 30, 35:
- Arrange in ascending order: 5, 6, 10, 12, 13, 15, 17, 17, 25, 30, 35
- Number of data points (n = 11).
- Median ((n) is odd) is the (\left(\frac{n + 1}{2}\right))-th value. (\frac{11+1}{2}=6) - th value, which is 15. This is incorrect as the box - plot median is around 20. For the data - set 0, 5, 10, 15, 25, 35, 40:
- Arrange in ascending order: 0, 5, 10, 15, 25, 35, 40
- (n = 7), median ((\frac{7 + 1}{2}=4) - th value) is 15. This is incorrect as the box - plot median is around 20. For the data - set 0, 5, 6, 10, 12, 13, 15, 17, 17, 25, 30, 35, 40:
- Arrange in ascending order: 0, 5, 6, 10, 12, 13, 15, 17, 17, 25, 30, 35, 40
- (n = 13), median ((\frac{13+1}{2}=7) - th value) is 15. This is incorrect as the box - plot median is around 20. For the data - set 5, 10, 15, 20, 25, 30, 35:
- Arrange in ascending order: 5, 10, 15, 20, 25, 30, 35
- (n = 7)
- Median ((\frac{7 + 1}{2}=4) - th value) is 20.
- First quartile ((Q1)): The lower half of the data is 5, 10, 15. (Q1) (median of lower half) is 10.
- Third quartile ((Q3)): The upper half of the data is 25, 30, 35. (Q3) (median of upper half) is 30. But considering the box - plot's rough estimates, this data - set is the closest as it has a minimum of 5, a median of 20, and values in the general range of the box - plot.
Answer:
5, 10, 15, 20, 25, 30, 35