marie made the box plot below to display a set of data. which set of data could the box plot represent? 5…
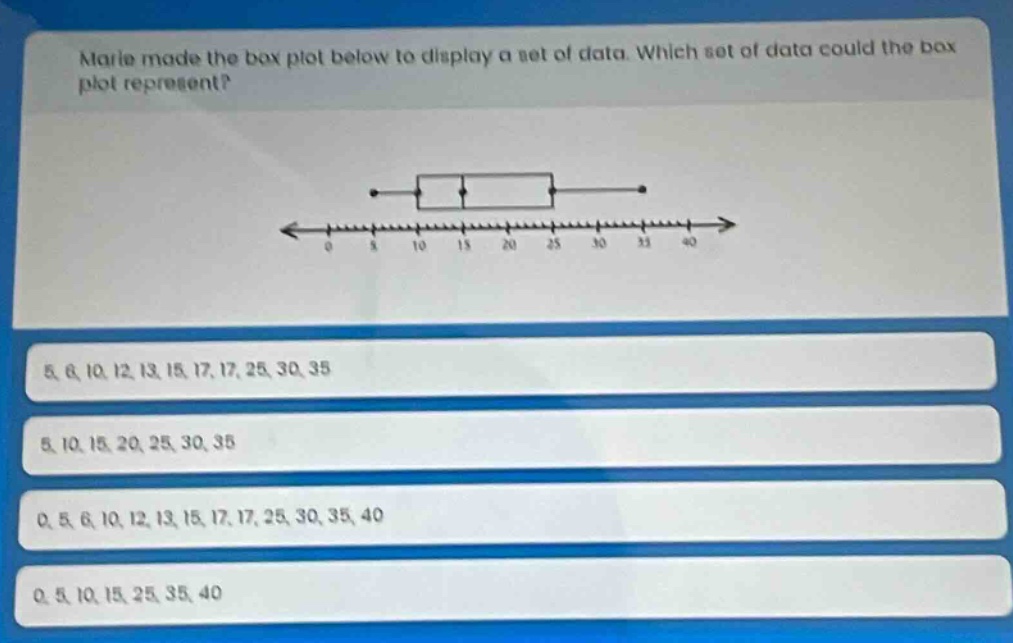
marie made the box plot below to display a set of data. which set of data could the box plot represent? 5, 6, 10, 12, 13, 15, 17, 17, 25, 30, 35 5, 10, 15, 20, 25, 30, 35 0, 5, 6, 10, 12, 13, 15, 17, 17, 25, 30, 35, 40 0, 5, 10, 15, 25, 35, 40
Answer
Explanation:
Step1: Identify key - points of box - plot
The minimum value of the box - plot is around 5, the first quartile ($Q_1$) is around 10, the median ($Q_2$) is around 15, the third quartile ($Q_3$) is around 25, and the maximum value is around 35.
Step2: Check each data set
For the first data set: 5, 6, 10, 12, 13, 15, 17, 17, 25, 30, 35. - Minimum = 5 - To find $Q_1$: There are 11 data points. The position of $Q_1$ is $\frac{11 + 1}{4}=3$. So $Q_1 = 10$. - Median position: $\frac{11+1}{2}=6$, so median $=15$. - $Q_3$ position: $3\times\frac{11 + 1}{4}=9$, so $Q_3 = 25$. - Maximum = 35. This data set matches the box - plot. For the second data set: 5, 10, 15, 20, 25, 30, 35. There are 7 data points. It doesn't have enough data to accurately represent the quartiles as in the box - plot. For the third data set: 0, 5, 6, 10, 12, 13, 15, 17, 17, 25, 30, 35, 40. The minimum is 0 which doesn't match the box - plot starting at 5. For the fourth data set: 0, 5, 10, 15, 25, 35, 40. There are 7 data points. It doesn't have enough data to accurately represent the quartiles as in the box - plot and the minimum is 0 which doesn't match.
Answer:
5, 6, 10, 12, 13, 15, 17, 17, 25, 30, 35