mario wants to create a pamphlet to convey how the energy generated by his companys solar panels varies…
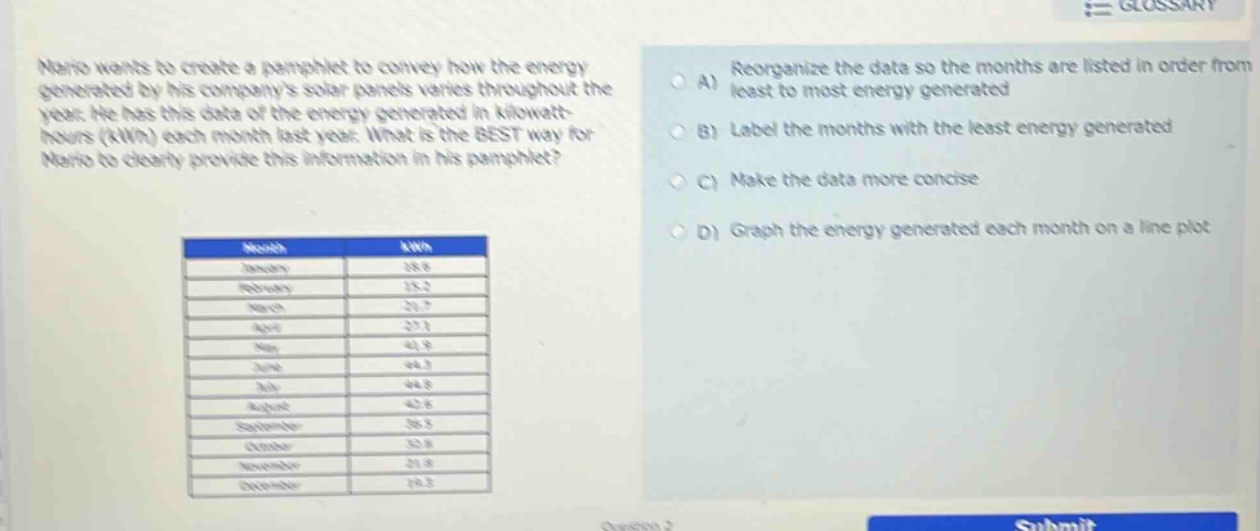
mario wants to create a pamphlet to convey how the energy generated by his companys solar panels varies throughout the year. he has this data of the energy generated in kilowatt - hours (kwh) each month last year. what is the best way for mario to clearly provide this information in his pamphlet?\na) reorganize the data so the months are listed in order from least to most energy generated\nb) label the months with the least energy generated\nc) make the data more concise\nd) graph the energy generated each month on a line plot
Answer
Brief Explanations:
A line plot is a visual representation that can clearly show the variation of energy generated each month over time. It allows for an easy comparison and understanding of the data trends. Reorganizing data (A) just changes the order but doesn't visually show the variation. Labeling only the least (B) ignores the overall variation. Making data concise (C) doesn't address showing the variation throughout the year. A line plot (D) is the best as it can display the energy values for each month in a visual way that conveys the variation clearly.
Answer:
D. Graph the energy generated each month on a line plot.