mark gathered data about the number of pink and red flowers that bloomed on several of his flowering shrubs…
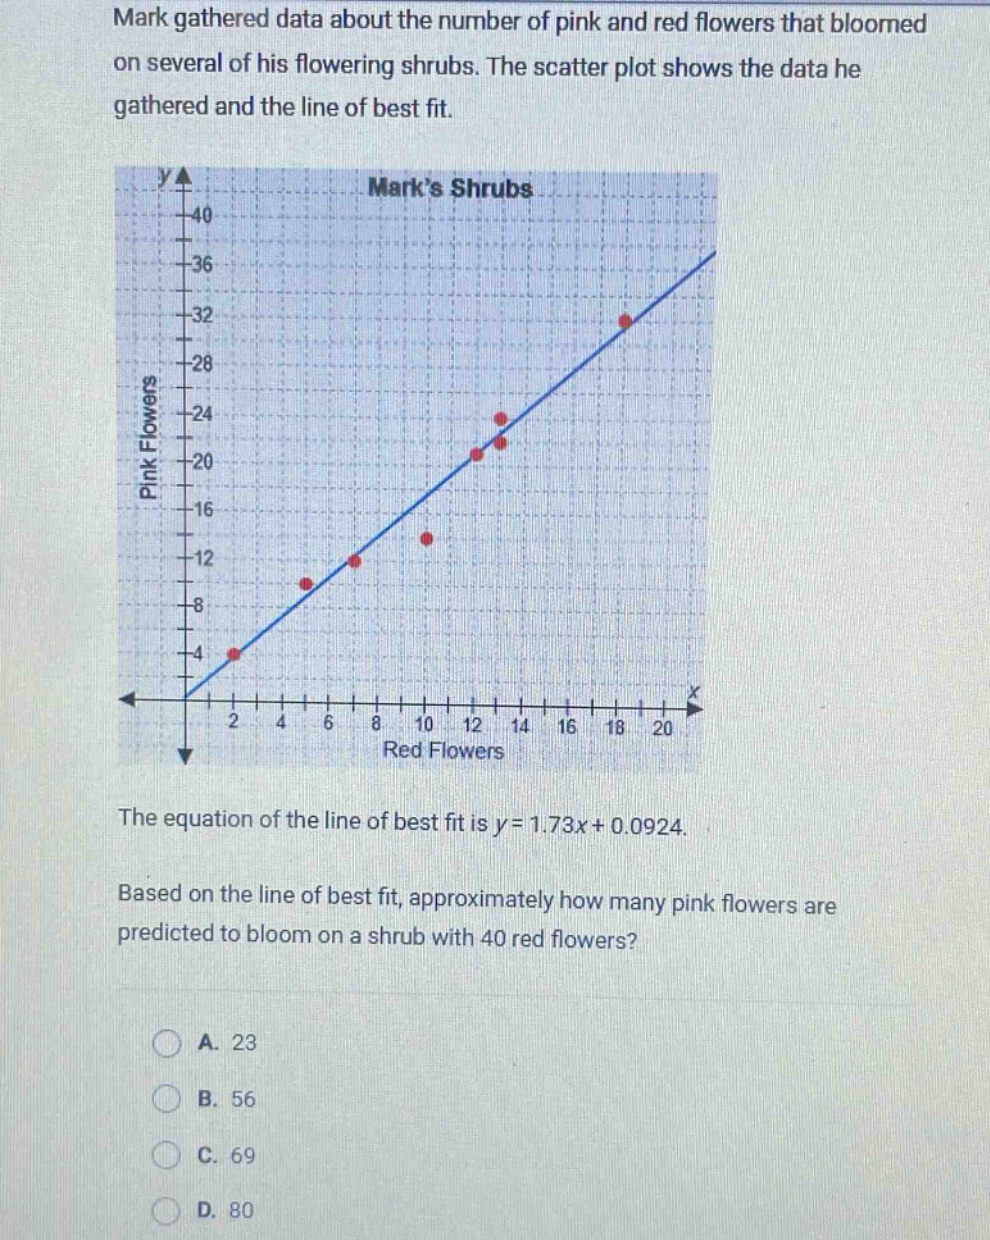
mark gathered data about the number of pink and red flowers that bloomed on several of his flowering shrubs. the scatter plot shows the data he gathered and the line of best fit. the equation of the line of best fit is y = 1.73x + 0.0924. based on the line of best fit, approximately how many pink flowers are predicted to bloom on a shrub with 40 red flowers? a. 23 b. 56 c. 69 d. 80
Answer
Answer:
C. 69
Explanation:
Step1: Identify the variables
Let $x$ be the number of red - flowers and $y$ be the number of pink - flowers. Given $x = 40$.
Step2: Substitute into the equation
Substitute $x = 40$ into $y=1.73x + 0.0924$. So $y=1.73\times40+0.0924$.
Step3: Calculate the value of $y$
First, calculate $1.73\times40 = 69.2$. Then $y=69.2 + 0.0924=69.2924\approx69$.