martha works at a doggy daycare. for two weeks, she counted the number of dogs at the daycare each day…
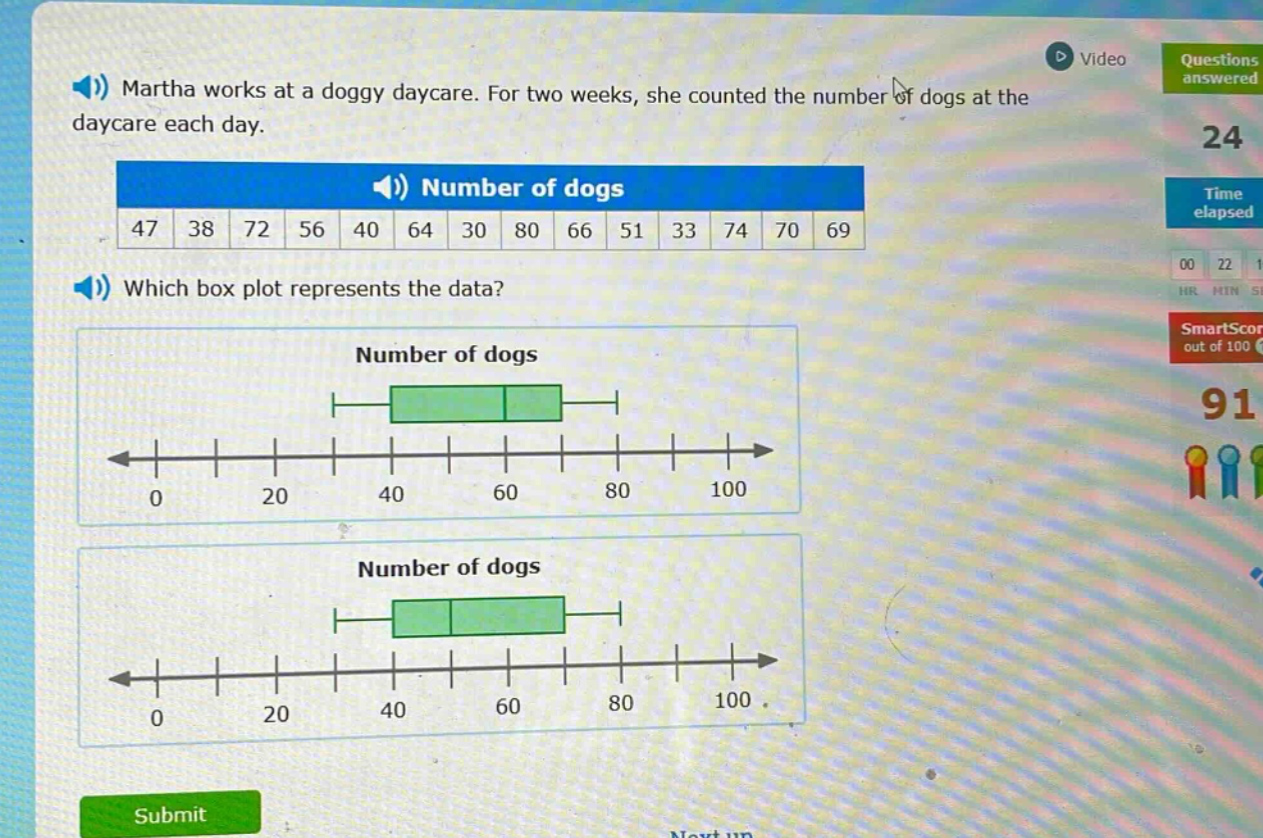
martha works at a doggy daycare. for two weeks, she counted the number of dogs at the daycare each day. number of dogs 47 38 72 56 40 64 30 80 66 51 33 74 70 69 which box plot represents the data? number of dogs 0 20 40 60 80 100 number of dogs 0 20 40 60 80 100
Answer
Explanation:
Step1: Arrange data in ascending order
$30,33,38,40,47,51,56,64,66,69,70,72,74,80$
Step2: Find the median (Q2)
There are $n = 14$ data - points. The median is the average of the 7th and 8th ordered values. So, $Q2=\frac{56 + 64}{2}=60$.
Step3: Find the lower - half data
The lower - half data is $30,33,38,40,47,51,56$. The median of the lower - half (Q1) is the 4th value, so $Q1 = 40$.
Step4: Find the upper - half data
The upper - half data is $64,66,69,70,72,74,80$. The median of the upper - half (Q3) is the 4th value of this sub - set, so $Q3=70$.
Step5: Identify the minimum and maximum
The minimum value is $30$ and the maximum value is $80$.
In a box - plot, the left - hand side of the box is at Q1, the line inside the box is at Q2, the right - hand side of the box is at Q3, the left whisker extends to the minimum, and the right whisker extends to the maximum. The box - plot with the box starting at 40, the line inside the box at 60, the box ending at 70, the left whisker starting at 30 and the right whisker ending at 80 is the correct one.
Answer:
The box - plot with the box starting at 40, the line inside the box at 60, the box ending at 70, the left whisker starting at 30 and the right whisker ending at 80.