match each correlation coefficient to the appropriate scatter plot. r = 0.4 r = 0.9 r = -0.4 r = -0.9
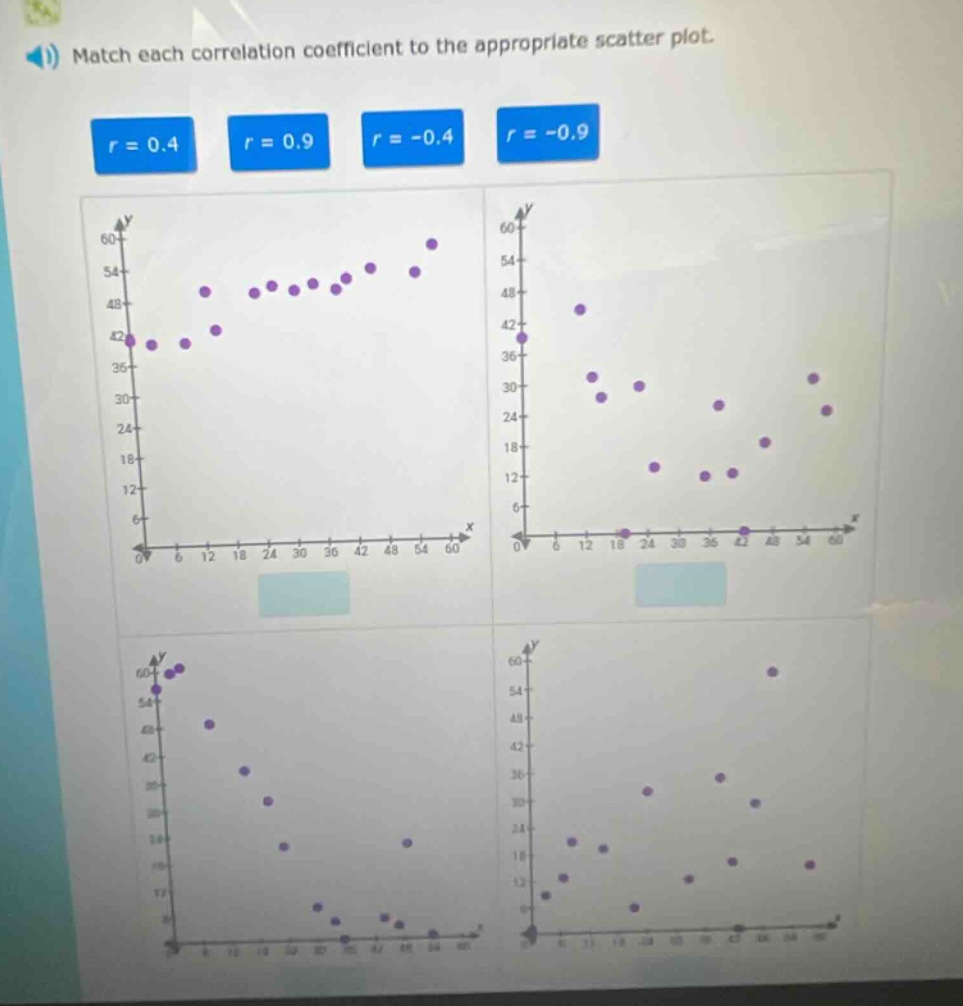
match each correlation coefficient to the appropriate scatter plot. r = 0.4 r = 0.9 r = -0.4 r = -0.9
Answer
Explanation:
Step1: Understand correlation coefficient
The correlation coefficient $r$ ranges from - 1 to 1. A positive $r$ indicates a positive - linear relationship (as $x$ increases, $y$ tends to increase), and a negative $r$ indicates a negative - linear relationship (as $x$ increases, $y$ tends to decrease). The closer $|r|$ is to 1, the stronger the linear relationship.
Step2: Analyze scatter - plots
For the first scatter - plot (top - left), the points show a positive linear trend, but the points are somewhat scattered. So, it corresponds to $r = 0.4$. For the second scatter - plot (top - right), the points are randomly scattered with no clear linear trend, which is not a good match for any of the given $r$ values. For the third scatter - plot (bottom - left), the points show a strong negative linear trend, so it corresponds to $r=-0.9$. For the fourth scatter - plot (bottom - right), the points show a negative linear trend, but not as strong as the third one, so it corresponds to $r = - 0.4$.
Answer:
Top - left: $r = 0.4$; Top - right: No match; Bottom - left: $r=-0.9$; Bottom - right: $r = - 0.4$