match each correlation coefficient to the appropriate scatter plot.\nr = 0.4 r = 0.9 r = -0.4 r = -0.9
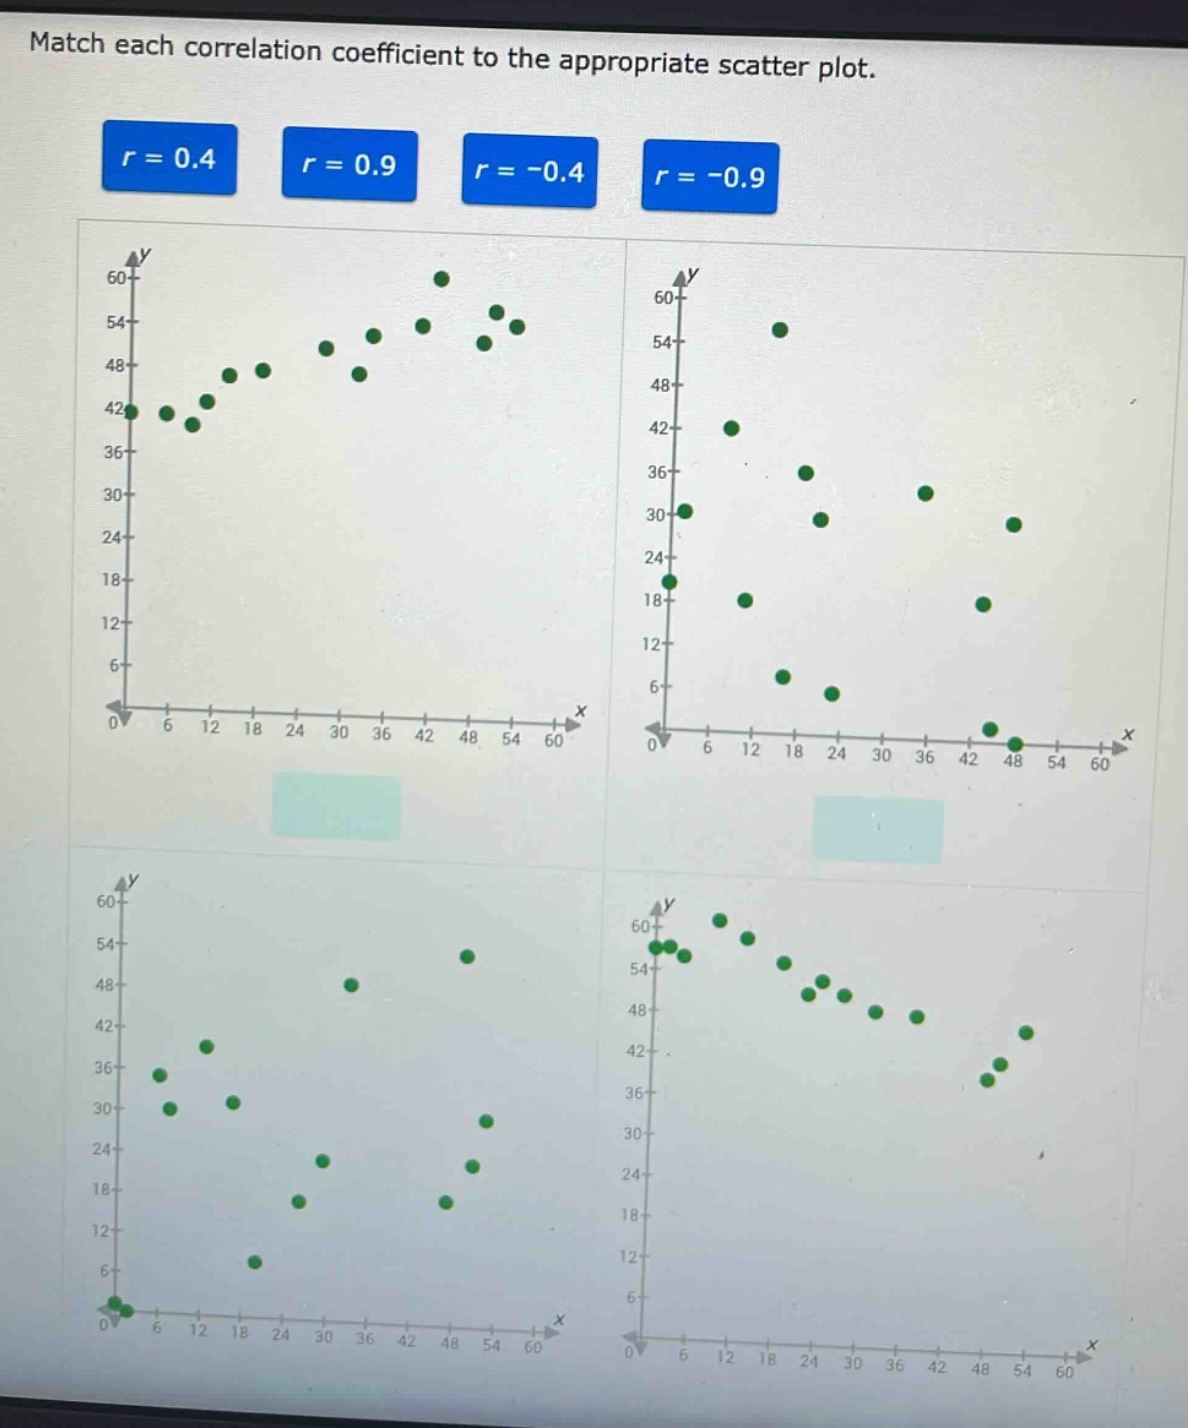
match each correlation coefficient to the appropriate scatter plot.\nr = 0.4 r = 0.9 r = -0.4 r = -0.9
Answer
Explanation:
Step1: Understand correlation coefficient
The correlation coefficient $r$ ranges from - 1 to 1. A positive $r$ indicates a positive - linear relationship (as $x$ increases, $y$ increases on average), and a negative $r$ indicates a negative - linear relationship (as $x$ increases, $y$ decreases on average). The closer $|r|$ is to 1, the stronger the linear relationship.
Step2: Analyze scatter - plots for positive correlations
For a positive correlation:
- When $r = 0.9$, the points in the scatter - plot should be closely clustered around a straight - line with a positive slope. When $r = 0.4$, the points should show a positive trend but be more spread out compared to $r = 0.9$.
Step3: Analyze scatter - plots for negative correlations
For a negative correlation:
- When $r=-0.9$, the points in the scatter - plot should be closely clustered around a straight - line with a negative slope. When $r = - 0.4$, the points should show a negative trend but be more spread out compared to $r=-0.9$.
Answer:
Without seeing the specific scatter - plots clearly, in general:
- The scatter - plot with points closely clustered in a positive - sloping line corresponds to $r = 0.9$.
- The scatter - plot with points showing a positive trend but more spread out corresponds to $r = 0.4$.
- The scatter - plot with points closely clustered in a negative - sloping line corresponds to $r=-0.9$.
- The scatter - plot with points showing a negative trend but more spread out corresponds to $r=-0.4$.