match each correlation coefficient to the appropriate scatter plot. the line in each scatter plot is the…
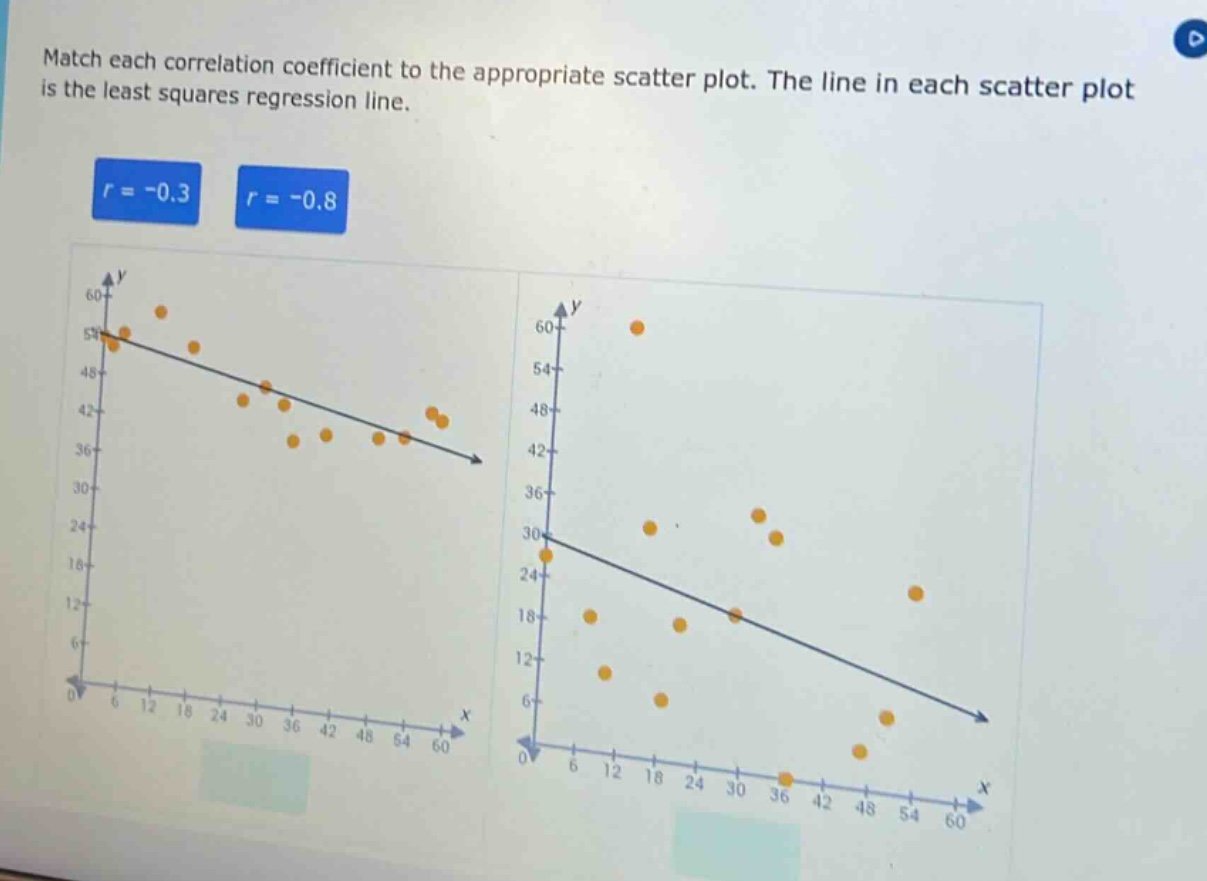
match each correlation coefficient to the appropriate scatter plot. the line in each scatter plot is the least squares regression line. r = -0.3 r = -0.8
Answer
Explanation:
Step1: Understand correlation coefficient
The correlation coefficient $r$ measures the strength and direction of a linear relationship. Values of $r$ range from - 1 to 1. A negative $r$ indicates a negative linear relationship. The closer $|r|$ is to 1, the stronger the linear relationship.
Step2: Analyze left - hand scatter plot
In the left - hand scatter plot, the points are relatively close to the regression line, indicating a relatively strong negative linear relationship. So, it corresponds to $r=-0.8$.
Step3: Analyze right - hand scatter plot
In the right - hand scatter plot, the points are more spread out from the regression line, indicating a weaker negative linear relationship. So, it corresponds to $r = - 0.3$.
Answer:
Left - hand scatter plot: $r=-0.8$, Right - hand scatter plot: $r=-0.3$