match each correlation coefficient to the appropriate scatter plot. the line in each scatter plot is the…
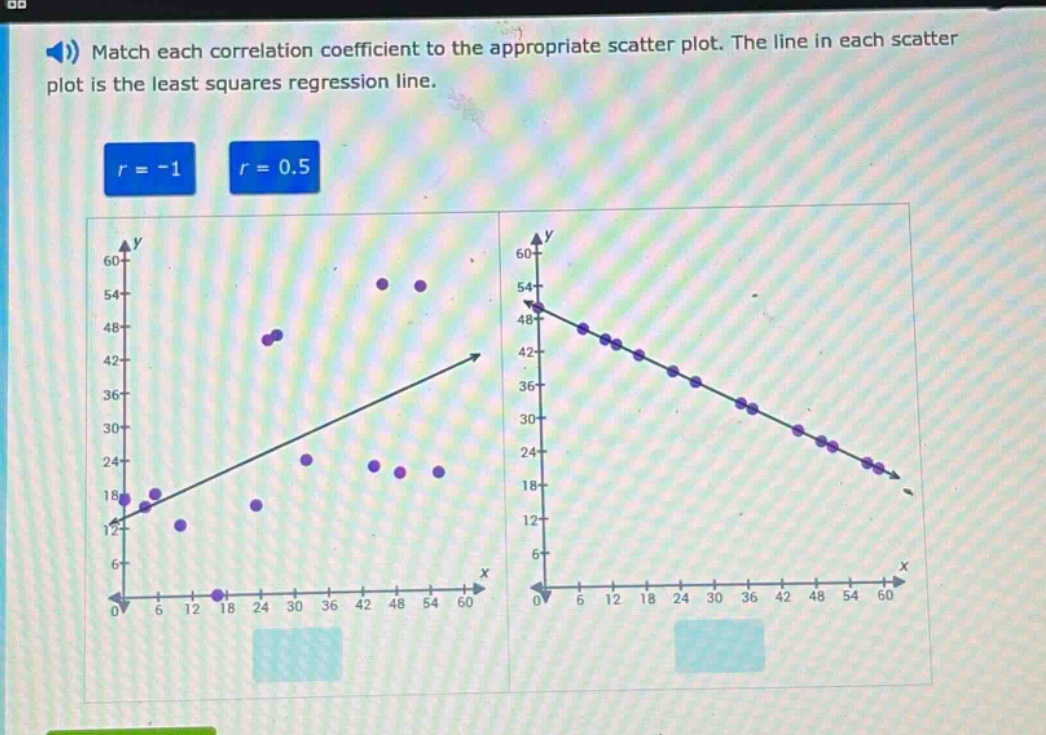
match each correlation coefficient to the appropriate scatter plot. the line in each scatter plot is the least squares regression line. r = -1 r = 0.5
Answer
Explanation:
Step1: Understand correlation coefficient
The correlation coefficient $r$ measures the strength and direction of a linear relationship. $r = - 1$ indicates a perfect negative linear - relationship (points lie exactly on a decreasing straight - line), and $r=0.5$ indicates a moderate positive linear relationship (points tend to increase together but not perfectly).
Step2: Analyze scatter - plots
In the left scatter - plot, the points show a moderate positive trend, so it corresponds to $r = 0.5$. In the right scatter - plot, the points lie almost exactly on a decreasing straight - line, so it corresponds to $r=-1$.
Answer:
Left scatter - plot: $r = 0.5$, Right scatter - plot: $r=-1$