match each correlation coefficient to the appropriate scatter plot. the line in each scatter plot is the…
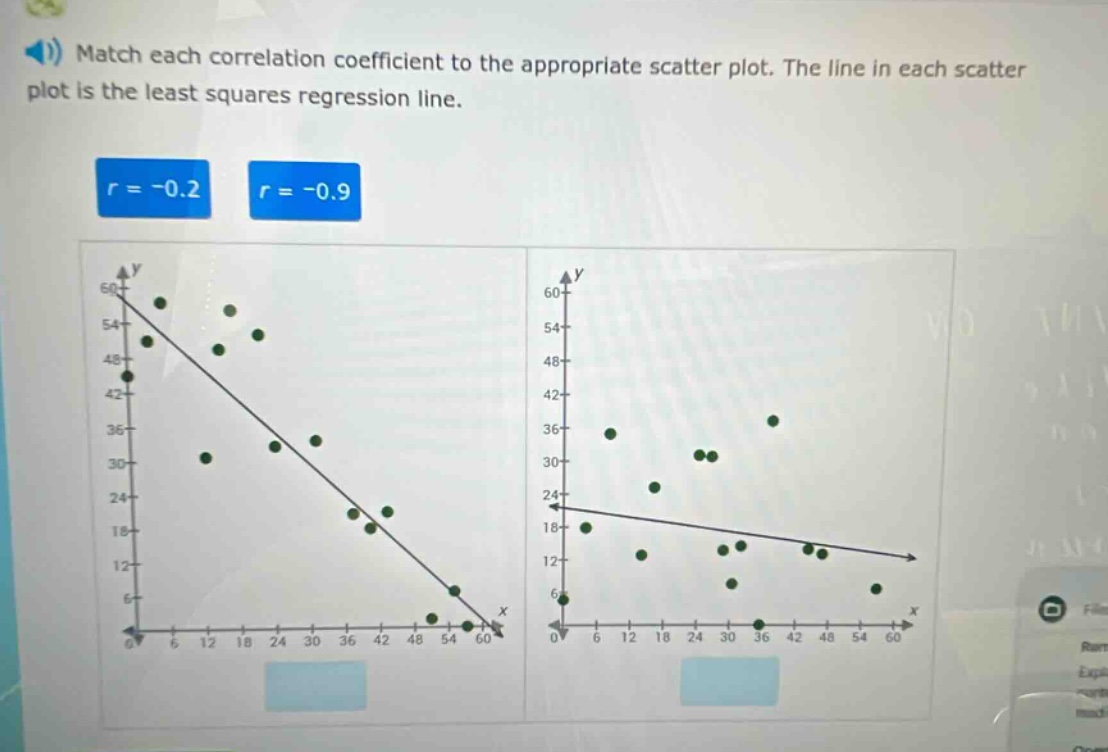
match each correlation coefficient to the appropriate scatter plot. the line in each scatter plot is the least squares regression line. r = -0.2 r = -0.9
Answer
Explanation:
Step1: Understand correlation coefficient
The correlation coefficient $r$ measures the strength and direction of a linear relationship. Values close to - 1 or 1 indicate a strong linear relationship, while values close to 0 indicate a weak linear relationship. A negative $r$ value means a negative - linear relationship (as $x$ increases, $y$ decreases).
Step2: Analyze $r=-0.9$
The value $r = - 0.9$ is close to - 1, so it represents a strong negative - linear relationship. The data points in the scatter - plot will be closely clustered around the least - squares regression line.
Step3: Analyze $r=-0.2$
The value $r=-0.2$ is close to 0, so it represents a weak negative - linear relationship. The data points in the scatter - plot will be more spread out around the least - squares regression line.
Step4: Match the scatter - plots
The scatter - plot on the left has data points closely clustered around the regression line, so it corresponds to $r=-0.9$. The scatter - plot on the right has data points more spread out around the regression line, so it corresponds to $r = - 0.2$.
Answer:
Left scatter - plot: $r=-0.9$; Right scatter - plot: $r=-0.2$