match the graph with its correlation coefficient.\nr = 0.88 r = 1 r = -0.49 r = -0.85 r = -0.09 r = 0.48
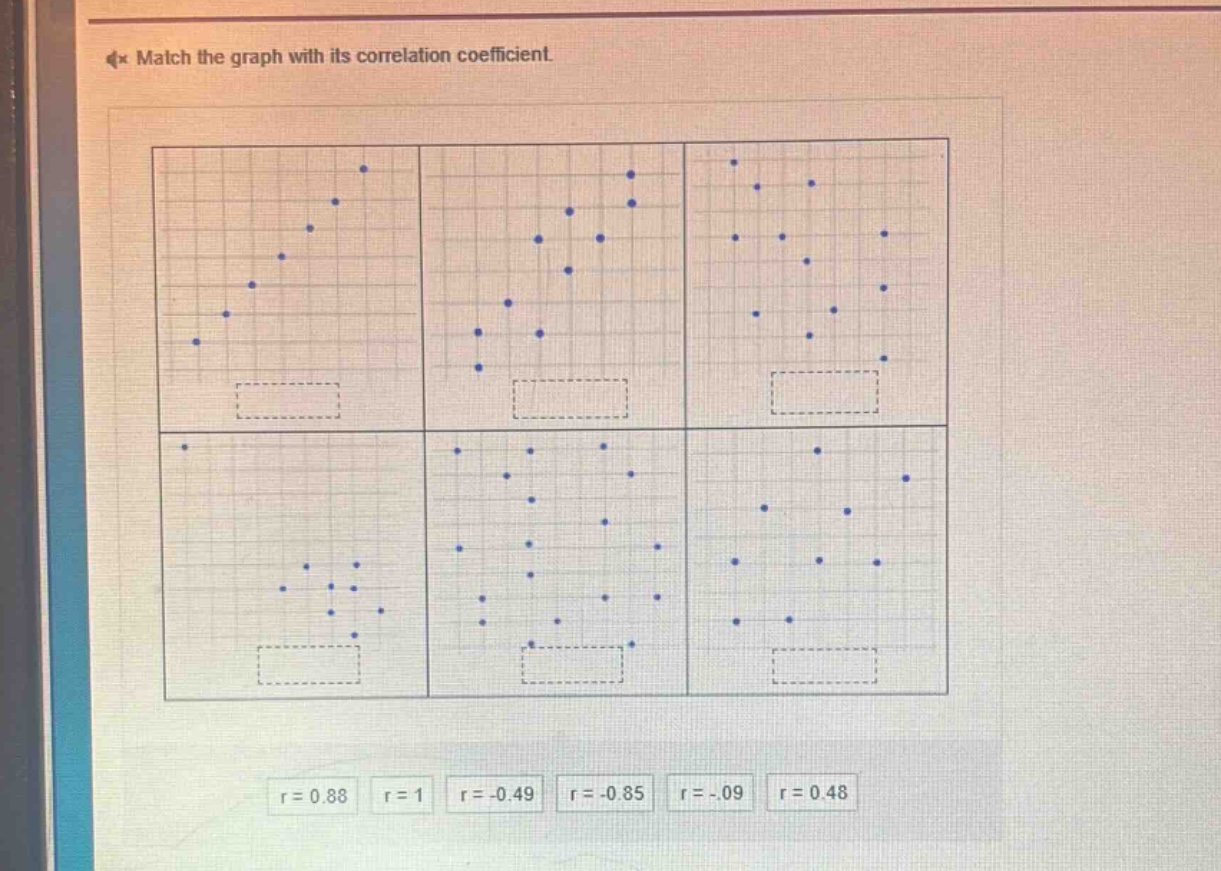
match the graph with its correlation coefficient.\nr = 0.88 r = 1 r = -0.49 r = -0.85 r = -0.09 r = 0.48
Answer
Answer:
- First graph: $r = 0.88$
- Second graph: $r = 0.48$
- Third graph: $r=- 0.09$
- Fourth graph: $r=-0.85$
- Fifth graph: $r = - 0.49$
- Sixth graph: $r = 1$
Explanation:
Step1: Understand positive - correlation
Positive - correlation means as one variable increases, the other tends to increase. Graphs with points roughly following an upward - sloping trend have positive $r$ values. The closer $r$ is to 1, the stronger the positive linear relationship.
Step2: Identify strong positive graph
The first graph has points tightly clustered in an upward - sloping pattern, so it has a high positive $r$ value, $r = 0.88$.
Step3: Identify moderate positive graph
The second graph has a more spread - out upward - sloping pattern, so it has a moderate positive $r$ value, $r = 0.48$.
Step4: Understand negative - correlation
Negative - correlation means as one variable increases, the other tends to decrease. Graphs with points roughly following a downward - sloping trend have negative $r$ values. The closer $r$ is to - 1, the stronger the negative linear relationship.
Step5: Identify weak negative graph
The third graph has points that show a very weak downward - sloping trend, so $r=-0.09$.
Step6: Identify strong negative graph
The fourth graph has points tightly clustered in a downward - sloping pattern, so $r=-0.85$.
Step7: Identify moderate negative graph
The fifth graph has a more spread - out downward - sloping pattern, so $r=-0.49$.
Step8: Identify perfect positive graph
The sixth graph has points that lie exactly on a straight upward - sloping line, so $r = 1$.