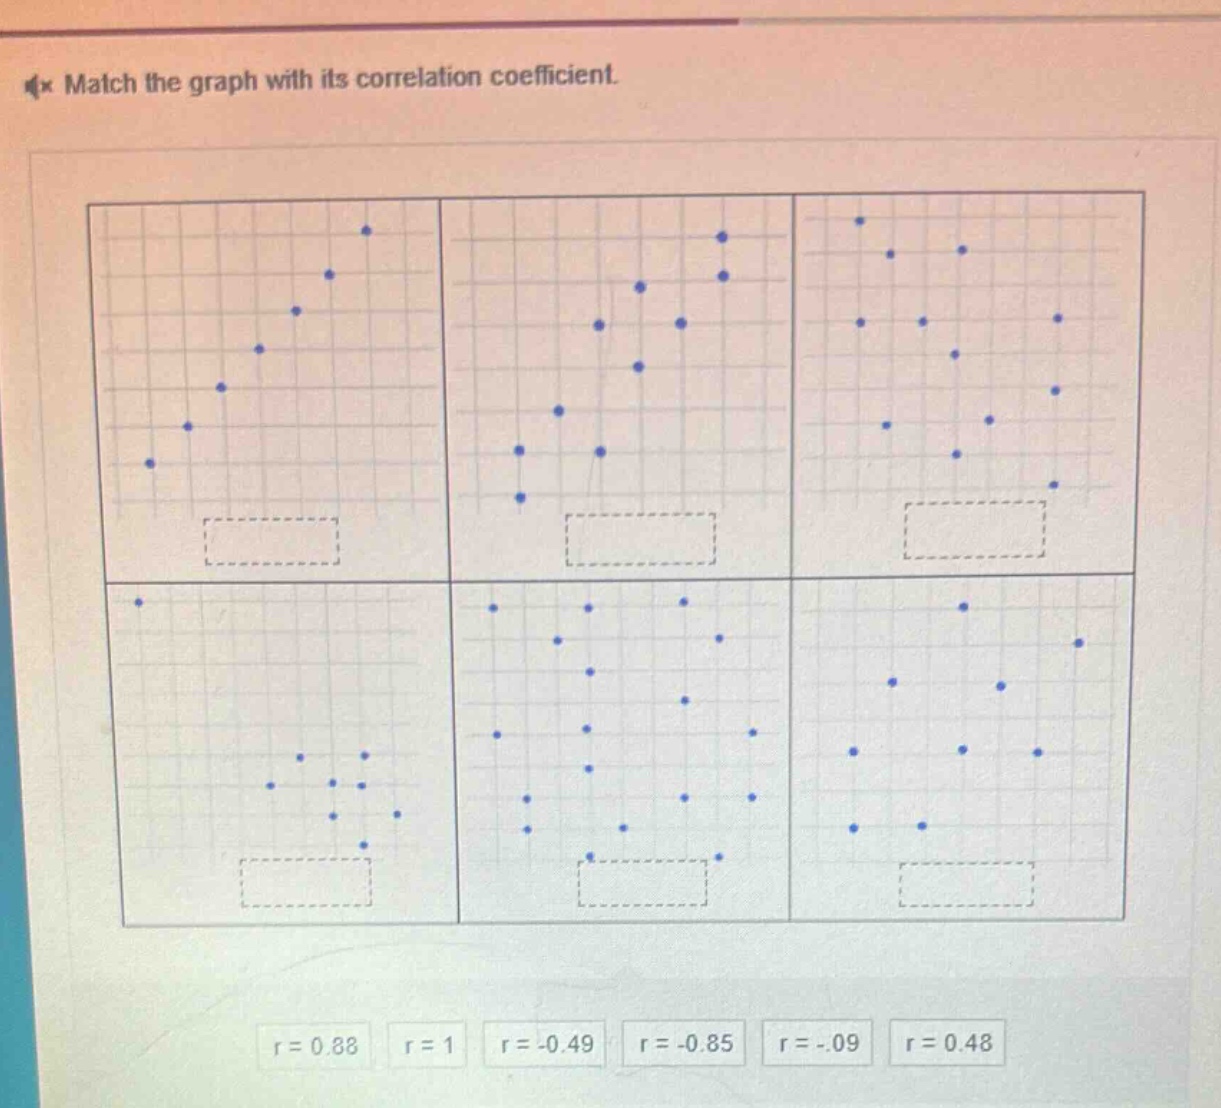
match the graph with its correlation coefficient.\nr = 0.88 r = 1 r = -0.49 r = -0.85 r = -0.09 r = 0.48
match the graph with its correlation coefficient.\nr = 0.88 r = 1 r = -0.49 r = -0.85 r = -0.09 r = 0.48
Answer
Answer:
Without seeing the individual scatter - plots clearly, we can use the general rules of correlation coefficients:
- If (r = 1), the points lie exactly on a straight - line with a positive slope.
- If (r=- 1), the points lie exactly on a straight - line with a negative slope.
- If (r>0), it is a positive correlation. The closer (r) is to 1, the stronger the positive linear relationship. For example, (r = 0.88) indicates a strong positive linear relationship and (r = 0.48) indicates a moderate positive linear relationship.
- If (r<0), it is a negative correlation. The closer (r) is to - 1, the stronger the negative linear relationship. For example, (r=-0.85) indicates a strong negative linear relationship and (r = - 0.49) indicates a moderate negative linear relationship. (r=-0.09) indicates a very weak negative linear relationship.
We would need to analyze each scatter - plot:
- For a scatter - plot with points closely following an upward - sloping line, it could be (r = 0.88) or (r = 0.48) (depending on how closely they follow the line).
- For a scatter - plot with points closely following a downward - sloping line, it could be (r=-0.85) or (r=-0.49) (depending on how closely they follow the line).
- For a scatter - plot with points that show almost no linear pattern, it could be (r=-0.09).
- A perfect positive linear relationship (points on a straight upward - sloping line) would have (r = 1).
Since the actual scatter - plots are not labeled for us to match one - by - one:
- If there is a scatter - plot with points tightly clustered in an upward - sloping line, the answer is (r = 0.88).
- If there is a scatter - plot with points in a perfect upward - sloping line, the answer is (r = 1).
- If there is a scatter - plot with points moderately clustered in a downward - sloping line, the answer is (r=-0.49).
- If there is a scatter - plot with points tightly clustered in a downward - sloping line, the answer is (r=-0.85).
- If there is a scatter - plot with points showing a very weak negative linear trend, the answer is (r=-0.09).
- If there is a scatter - plot with points moderately clustered in an upward - sloping line, the answer is (r = 0.48).
Explanation:
Step1: Understand correlation coefficient concept
The correlation coefficient (r) measures the strength and direction of a linear relationship between two variables. Its value ranges from - 1 to 1.
Step2: Analyze positive correlations
Positive (r) values ((r>0)) mean as one variable increases, the other tends to increase. Larger positive (r) values (closer to 1) indicate a stronger positive linear relationship.
Step3: Analyze negative correlations
Negative (r) values ((r < 0)) mean as one variable increases, the other tends to decrease. Larger negative (r) values (closer to - 1) indicate a stronger negative linear relationship.
Step4: Analyze weak correlations
Values of (r) close to 0 (like (r=-0.09)) indicate a very weak linear relationship.