mavs math teacher plots student grades on their weekly quizzes against the number of hours they say they…
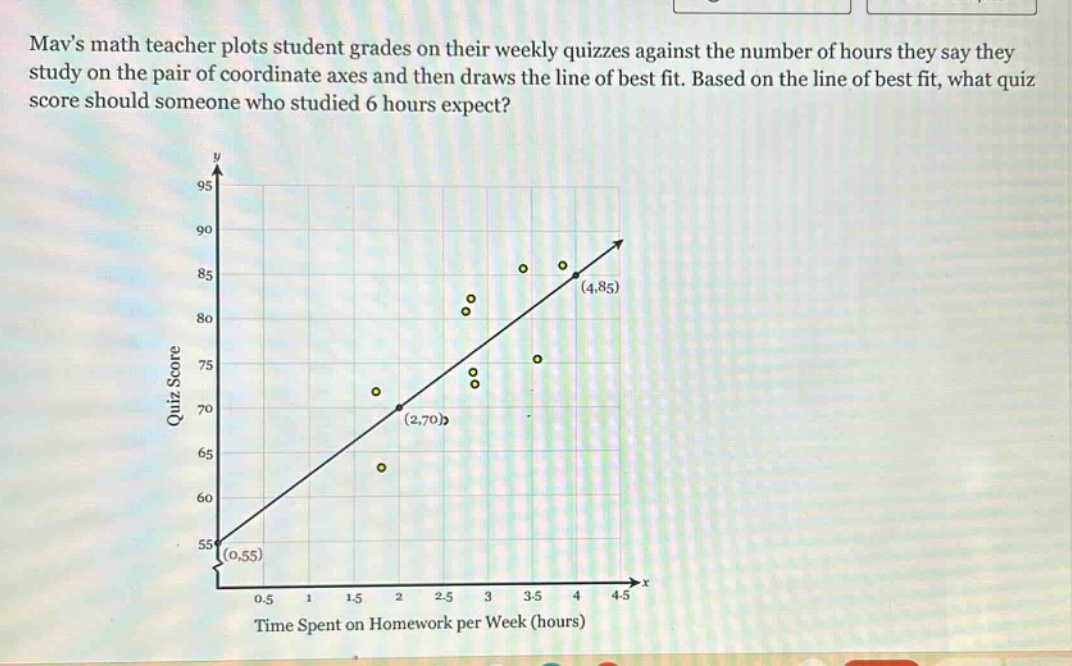
mavs math teacher plots student grades on their weekly quizzes against the number of hours they say they study on the pair of coordinate axes and then draws the line of best fit. based on the line of best fit, what quiz score should someone who studied 6 hours expect?
Answer
Answer:
(100)
Explanation:
Step1: Calculate the slope of the line of best fit
The formula for slope (m=\frac{y_2 - y_1}{x_2 - x_1}). Using the points ((0,55)) and ((2,70)), we have (m=\frac{70 - 55}{2-0}=\frac{15}{2} = 7.5).
Step2: Use the point - slope form (y - y_1=m(x - x_1))
Using the point ((0,55)) (where (x_1 = 0,y_1 = 55) and (m = 7.5)), the equation of the line is (y-55=7.5(x - 0)), so (y = 7.5x+55).
Step3: Substitute (x = 6) into the equation
When (x = 6), (y=7.5\times6 + 55). First, calculate (7.5\times6=45). Then (y=45 + 55).