the mean ages with standard deviations of four swim teams at a swim club are given below.\n| team | mean |…
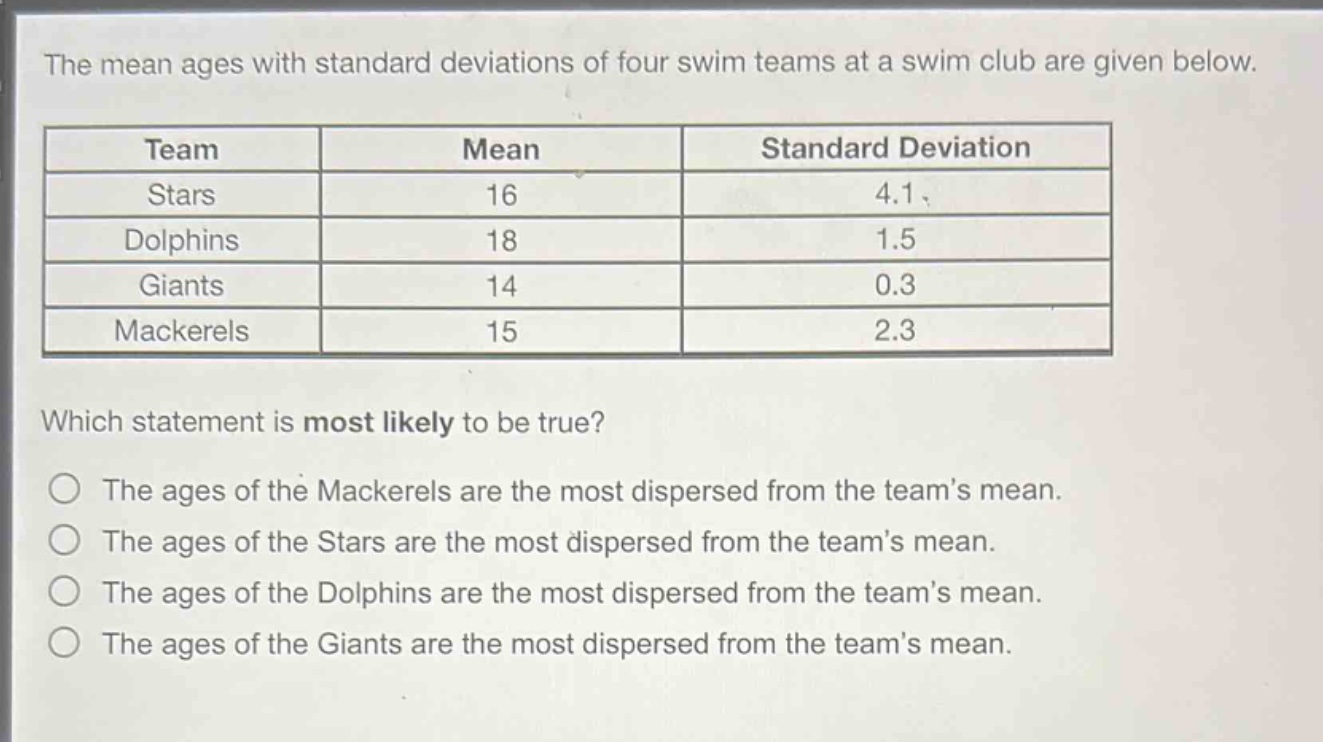
the mean ages with standard deviations of four swim teams at a swim club are given below.\n| team | mean | standard deviation |\n| stars | 16 | 4.1 |\n| dolphins | 18 | 1.5 |\n| giants | 14 | 0.3 |\n| mackerels | 15 | 2.3 |\nwhich statement is most likely to be true?\nthe ages of the mackerels are the most dispersed from the teams mean.\nthe ages of the stars are the most dispersed from the teams mean.\nthe ages of the dolphins are the most dispersed from the teams mean.\nthe ages of the giants are the most dispersed from the teams mean.
Answer
Explanation:
Step1: Recall the meaning of standard - deviation
Standard deviation measures the dispersion of data from the mean. Larger standard - deviation means more dispersion.
Step2: Compare the standard deviations
We have: Stars' standard deviation = 4.1, Dolphins' standard deviation = 1.5, Giants' standard deviation = 0.3, Mackerels' standard deviation = 2.3. Since 4.1>2.3>1.5>0.3, the Stars have the largest standard deviation.
Answer:
The ages of the Stars are the most dispersed from the team's mean.