the mean game scores and standard deviations of four seasons of a football team are given below.\n| season |…
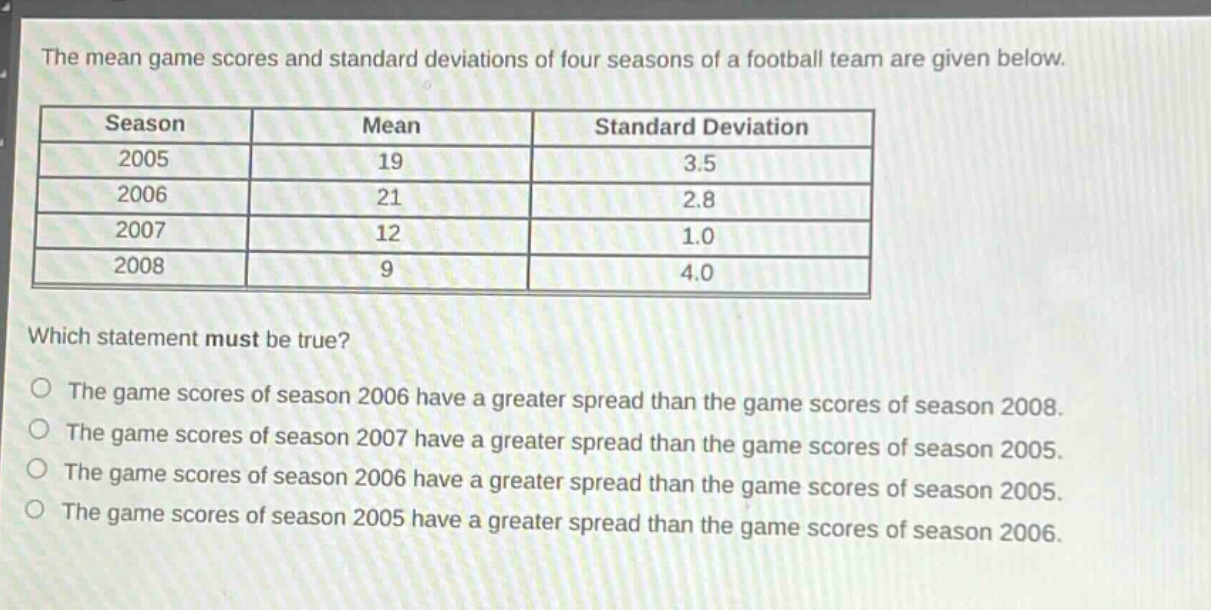
the mean game scores and standard deviations of four seasons of a football team are given below.\n| season | mean | standard deviation |\n| ---- | ---- | ---- |\n| 2005 | 19 | 3.5 |\n| 2006 | 21 | 2.8 |\n| 2007 | 12 | 1.0 |\n| 2008 | 9 | 4.0 |\nwhich statement must be true?\nthe game scores of season 2006 have a greater spread than the game scores of season 2008.\nthe game scores of season 2007 have a greater spread than the game scores of season 2005.\nthe game scores of season 2006 have a greater spread than the game scores of season 2005.\nthe game scores of season 2005 have a greater spread than the game scores of season 2006.
Answer
Explanation:
Step1: Recall the meaning of standard - deviation
Standard deviation measures the spread of data. Larger standard deviation means greater spread.
Step2: Compare standard deviations
For 2005, standard deviation is 3.5. For 2006, standard deviation is 2.8. For 2007, standard deviation is 1.0. For 2008, standard deviation is 4.0. Since 3.5>2.8, the game scores of season 2005 have a greater spread than the game scores of season 2006.
Answer:
The game scores of season 2005 have a greater spread than the game scores of season 2006.