how does the mean and median change from plot 1 to plot 2?\nthe mean and median remain the same.\nthe mean…
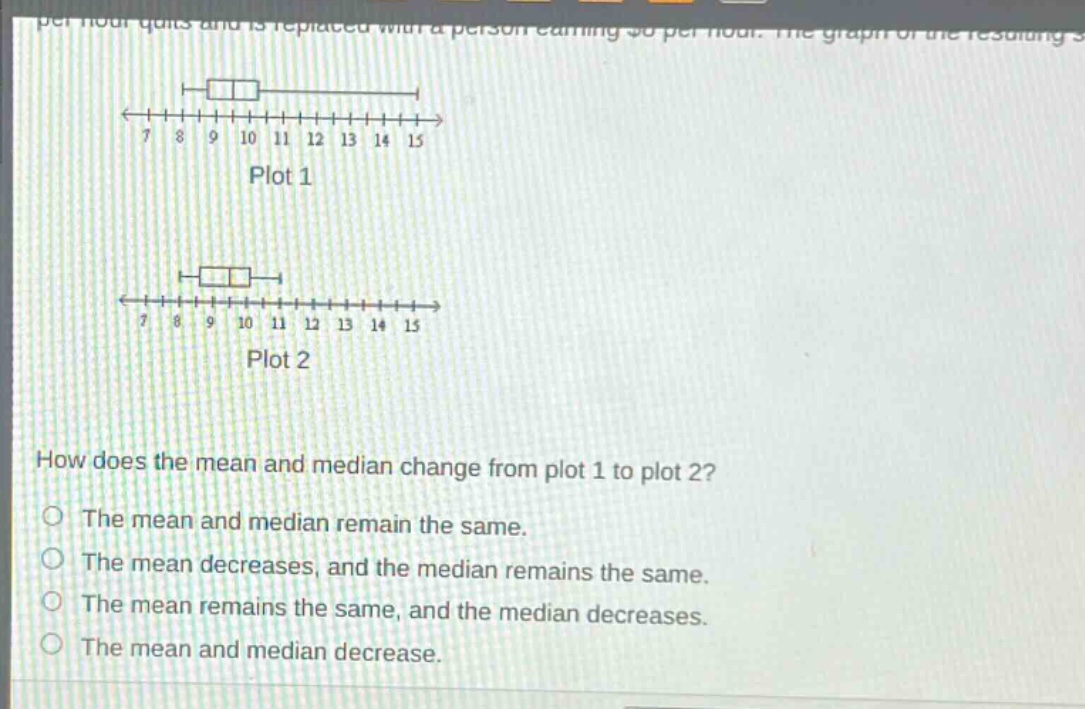
how does the mean and median change from plot 1 to plot 2?\nthe mean and median remain the same.\nthe mean decreases, and the median remains the same.\nthe mean remains the same, and the median decreases.\nthe mean and median decrease.
Answer
Explanation:
Step1: Recall mean and median concepts
Mean is sum of values divided by number of values. Median is middle - value when data is ordered.
Step2: Analyze median
The position of the median in a box - and - whisker plot is represented by the line inside the box. In both Plot 1 and Plot 2, the position of the line inside the box (median) is the same. So the median remains the same.
Step3: Analyze mean
Since a higher - value data point is replaced with a lower - value data point (a person earning more is replaced with a person earning less), the sum of all the values in the data set will decrease. As the number of data points remains the same, and mean=$\frac{\text{Sum of values}}{\text{Number of values}}$, the mean will decrease.
Answer:
The mean decreases, and the median remains the same.