the mean of the temperatures in the chart is 24° with standard deviation of 4°. how many years had…
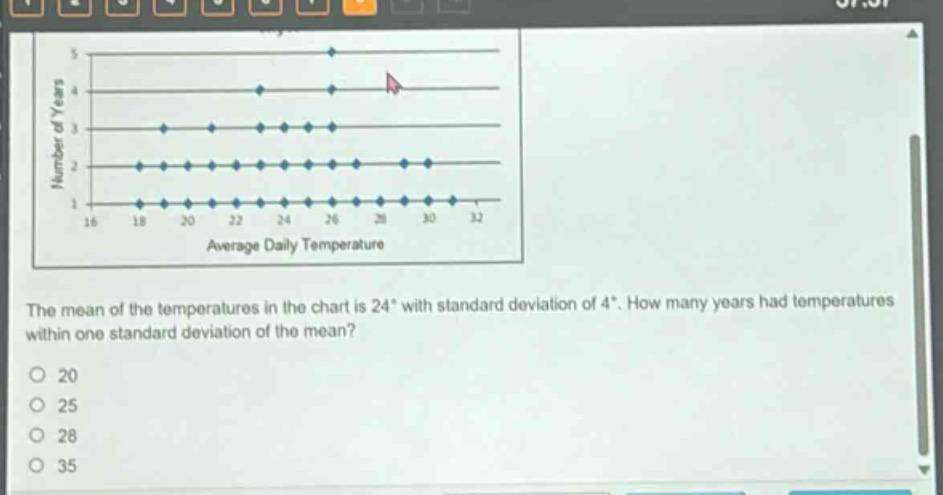
the mean of the temperatures in the chart is 24° with standard deviation of 4°. how many years had temperatures within one standard deviation of the mean?\n20\n25\n28\n35
Answer
Explanation:
Step1: Determine the range
The range within one - standard deviation of the mean is from $\mu-\sigma$ to $\mu + \sigma$. Given $\mu = 24$ and $\sigma=4$, the range is $24 - 4=20$ to $24 + 4 = 28$.
Step2: Count the data points in the range
Count the number of blue - dots (representing years) with $x$-values (average daily temperature) between $20$ and $28$ on the graph. By counting, we find there are 25 such points.
Answer:
25