what is the median of the ages in this stem - and - leaf plot? 43 45 46 47 employees ages 2|2 3 9 3|1 4 6 8…
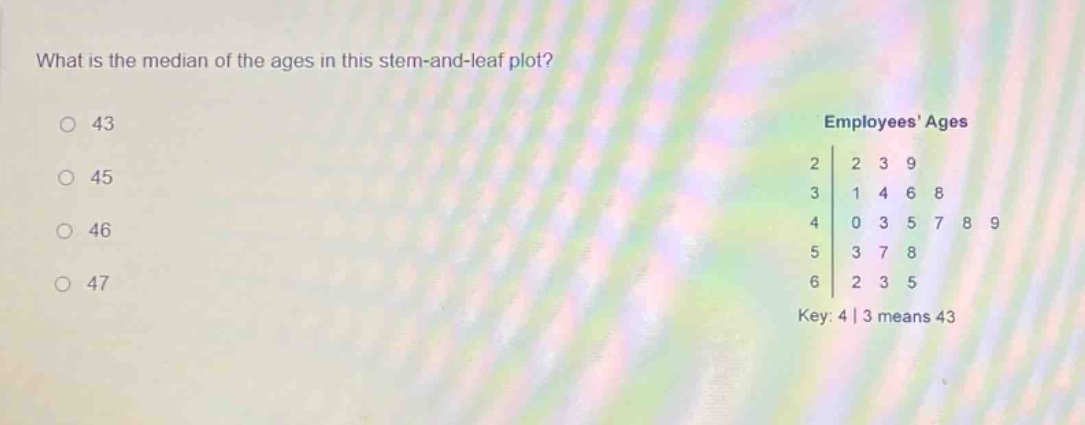
what is the median of the ages in this stem - and - leaf plot? 43 45 46 47 employees ages 2|2 3 9 3|1 4 6 8 4|0 3 5 7 8 9 5|3 7 8 6|2 3 5 key: 4|3 means 43
Answer
Explanation:
Step1: Count the data - points
Count the number of values in the stem - and - leaf plot. There are 3 + 4+6 + 3+3=19 values.
Step2: Determine the position of the median
For a set of (n) values (where (n = 19) is odd), the median is the (\left(\frac{n + 1}{2}\right))-th value. (\frac{19+1}{2}=10) - th value.
Step3: List out the data in ascending order
The data in ascending order: 22, 23, 29, 31, 34, 36, 38, 40, 43, 45, 47, 48, 49, 53, 57, 58, 62, 63, 65.
Step4: Identify the median
The 10 - th value in the ordered list is 45.
Answer:
45