megan attends an online school. as part of a math project, she kept track of how many hours she spent at her…
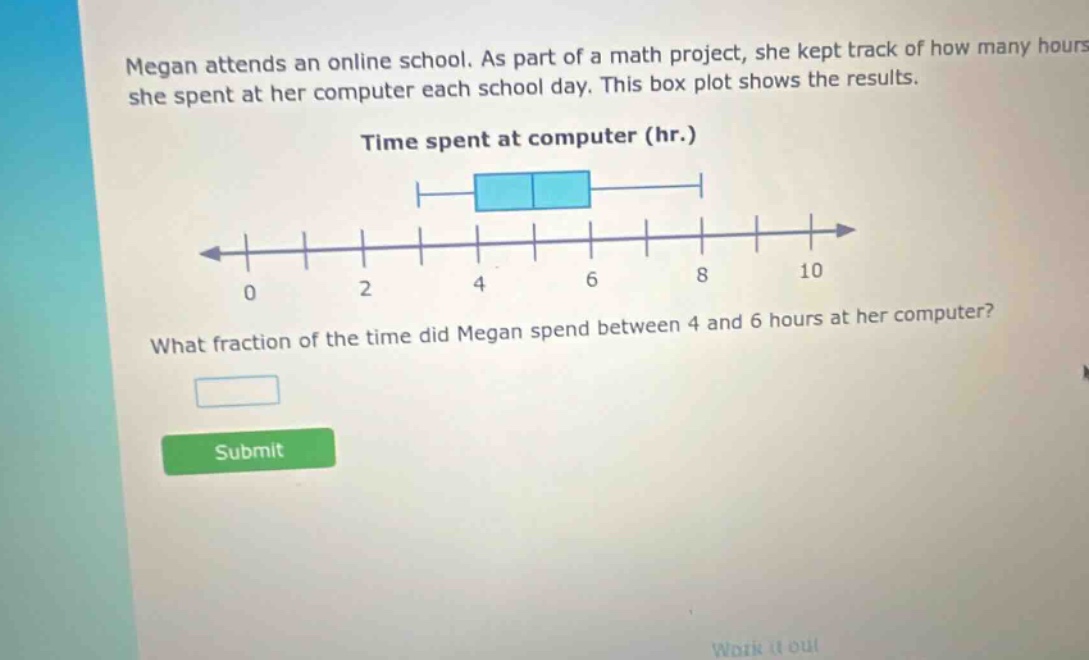
megan attends an online school. as part of a math project, she kept track of how many hours she spent at her computer each school day. this box plot shows the results. time spent at computer (hr.) what fraction of the time did megan spend between 4 and 6 hours at her computer?
Answer
Explanation:
Step1: Recall box - plot properties
A box - plot divides the data into quartiles. The box represents the inter - quartile range (IQR), which contains 50% of the data. The lower half of the box is the first quartile ($Q_1$) to the median ($Q_2$) and the upper half is from the median ($Q_2$) to the third quartile ($Q_3$).
Step2: Identify the range in the box - plot
In a box - plot, the range from 4 to 6 hours represents the inter - quartile range (IQR). The IQR contains 50% or $\frac{1}{2}$ of the data.
Answer:
$\frac{1}{2}$