michael recorded the number of points his team scored for the first seven basketball games. 64, 58, 60, 52…
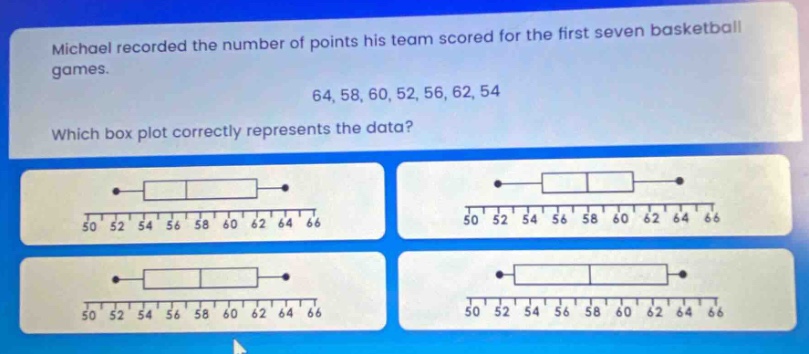
michael recorded the number of points his team scored for the first seven basketball games. 64, 58, 60, 52, 56, 62, 54 which box plot correctly represents the data?
Answer
Explanation:
Step1: Arrange data in ascending order
$52,54,56,58,60,62,64$
Step2: Find the median (Q2)
Since there are 7 data - points, the median is the 4th value. So, $Q2 = 58$.
Step3: Find the lower half of data
The lower half is $52,54,56$. The median of the lower half (Q1) is 54.
Step4: Find the upper half of data
The upper half is $60,62,64$. The median of the upper half (Q3) is 62.
Step5: Identify the minimum and maximum
The minimum value is 52 and the maximum value is 64.
The box - plot should have a box from 54 (Q1) to 62 (Q3) with a line at 58 (Q2) inside the box, and whiskers extending to 52 (minimum) and 64 (maximum).
Answer:
The box - plot with a box from 54 to 62, a line at 58 inside the box, and whiskers extending to 52 and 64. (Without seeing the exact visual differences in the provided box - plots, based on the calculated values this is the correct description of the box - plot).