michelle is comparing the incomes of two neighborhoods in their city. neighborhood a has a mean income of…
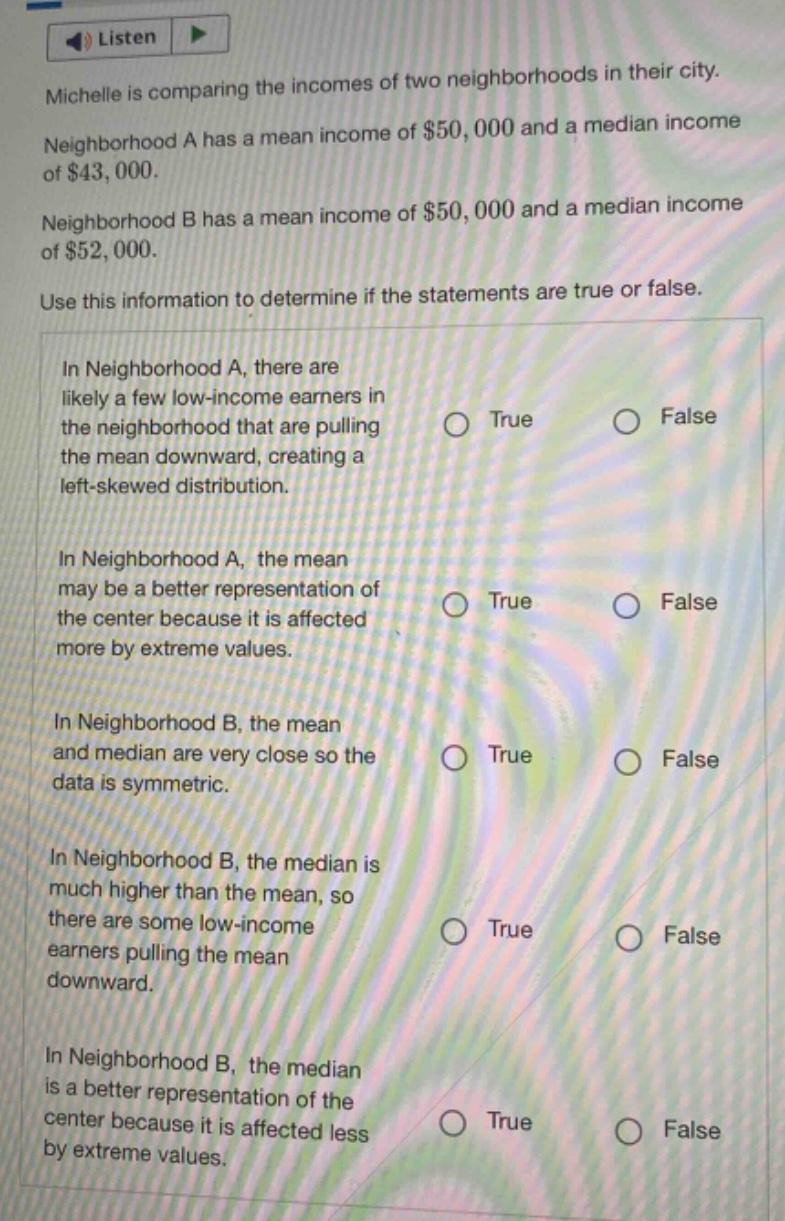
michelle is comparing the incomes of two neighborhoods in their city. neighborhood a has a mean income of $50,000 and a median income of $43,000. neighborhood b has a mean income of $50,000 and a median income of $52,000. use this information to determine if the statements are true or false. in neighborhood a, there are likely a few low - income earners in the neighborhood that are pulling the mean downward, creating a left - skewed distribution. in neighborhood a, the mean may be a better representation of the center because it is affected more by extreme values. in neighborhood b, the mean and median are very close so the data is symmetric. in neighborhood b, the median is much higher than the mean, so there are some low - income earners pulling the mean downward. in neighborhood b, the median is a better representation of the center because it is affected less by extreme values.
Answer
Answer:
- False
- False
- True
- False
- True
Explanation:
Step1: Analyze Neighborhood A
In Neighborhood A, mean ($50,000$) > median ($43,000$). This indicates a right - skewed distribution, not left - skewed, so the first statement is false.
Step2: Understand mean and median for Neighborhood A
The median is less affected by extreme values. Since Neighborhood A is right - skewed, the median is a better measure of center, so the second statement is false.
Step3: Examine Neighborhood B
In Neighborhood B, mean ($50,000$) and median ($52,000$) are close. When mean and median are close, data is symmetric, so the third statement is true.
Step4: Analyze Neighborhood B's mean and median
In Neighborhood B, median ($52,000$) > mean ($50,000$). This implies some high - income earners pulling the median up, not low - income earners pulling the mean down, so the fourth statement is false.
Step5: Understand median for Neighborhood B
The median is less affected by extreme values. In Neighborhood B, due to possible outliers (since median>mean), the median is a better representation of the center, so the fifth statement is true.