a mini - golf course is determining the par score for each of its holes. the dot plot shows the number of…
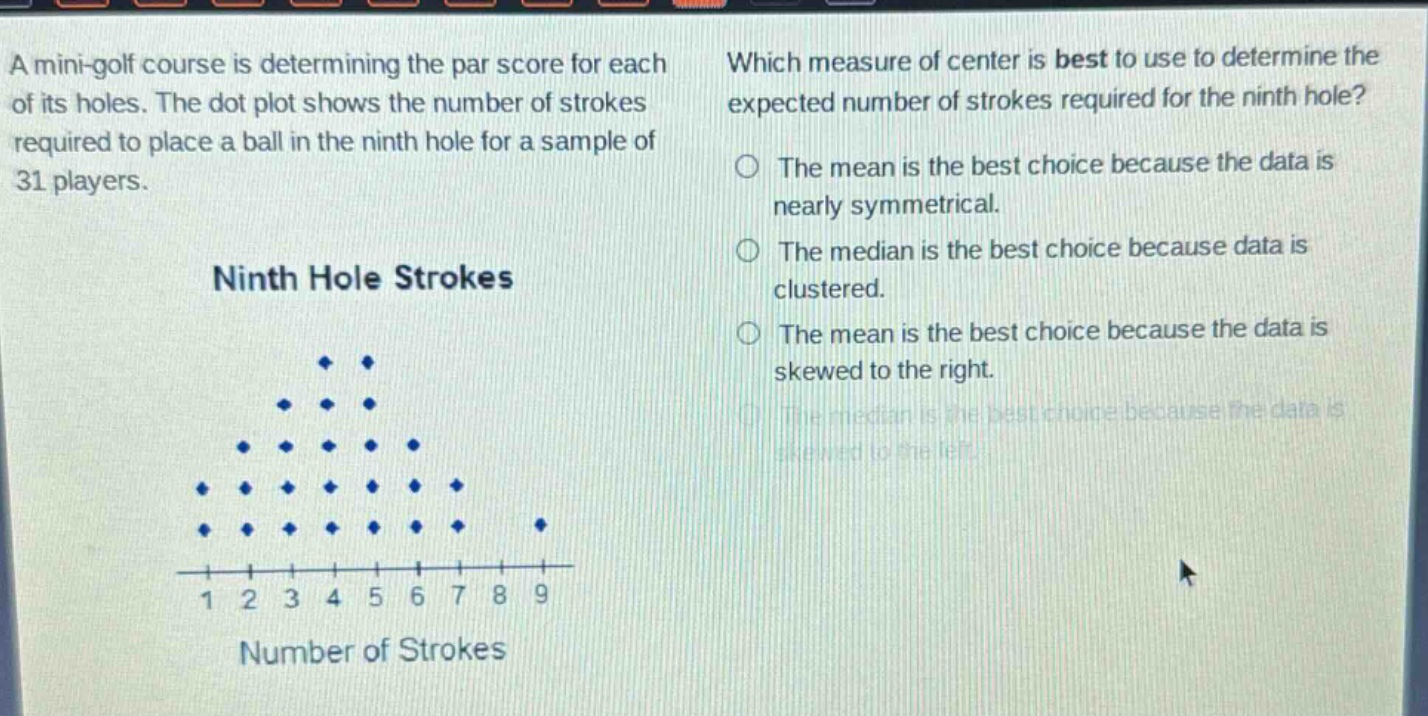
a mini - golf course is determining the par score for each of its holes. the dot plot shows the number of strokes required to place a ball in the ninth hole for a sample of 31 players. which measure of center is best to use to determine the expected number of strokes required for the ninth hole? ninth hole strokes number of strokes 1 2 3 4 5 6 7 8 9 the mean is the best choice because the data is nearly symmetrical. the median is the best choice because data is clustered. the mean is the best choice because the data is skewed to the right. the median is the best choice because the data is skewed to the left.
Answer
Answer:
The mean is the best choice because the data is nearly symmetrical.
Explanation:
Step1: Analyze data shape
The dot - plot shows a nearly symmetrical distribution.
Step2: Recall measure properties
The mean is a good measure for symmetrical data as it takes into account all values.
Step3: Eliminate other options
Median is better for skewed or non - symmetrical data, so other options are incorrect.