the minimum of the data is \nthe first quartile is \nthe median of the data is \nthe third quartile is \nthe…
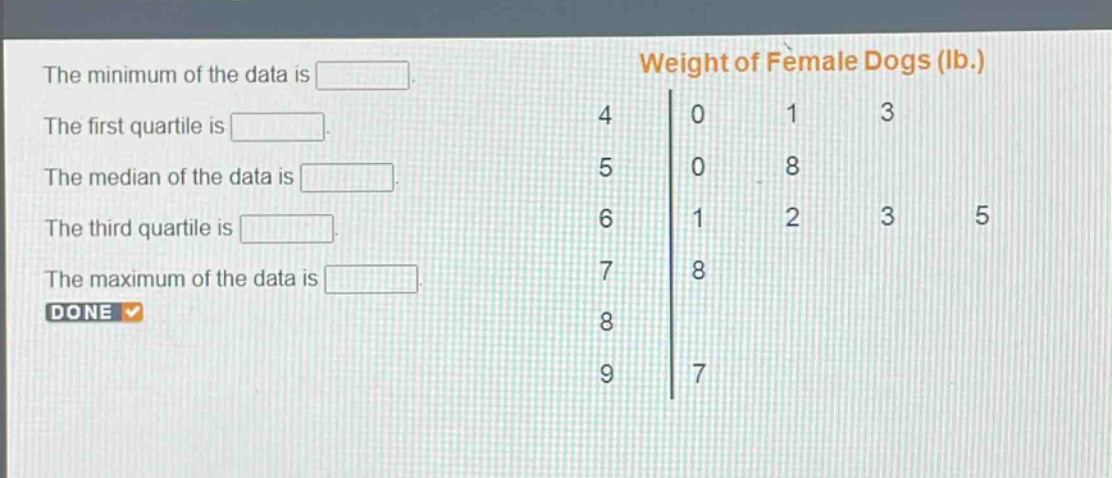
the minimum of the data is \nthe first quartile is \nthe median of the data is \nthe third quartile is \nthe maximum of the data is \nweight of female dogs (lb.)\n4 0 1 3\n5 0 8\n6 1 2 3 5\n7 8\n8\n9 7
Answer
Explanation:
Step1: Write out the data set
The data set from the stem - and - leaf plot is (40,41,43,50,58,61,62,63,65,78,97).
Step2: Find the minimum
The minimum is the smallest value. So, the minimum is (40).
Step3: Arrange data in ascending order
The data is already in ascending order: (40,41,43,50,58,61,62,63,65,78,97). There are (n = 11) data points.
Step4: Find the first quartile (Q_1)
The position of (Q_1) is (\frac{n + 1}{4}=\frac{11+ 1}{4}=3). So, (Q_1) is the 3rd value in the ordered data set, which is (43).
Step5: Find the median
The position of the median for (n = 11) (odd number of data points) is (\frac{n + 1}{2}=\frac{11+1}{2}=6). So, the median is the 6th value, which is (61).
Step6: Find the third quartile (Q_3)
The position of (Q_3) is (\frac{3(n + 1)}{4}=\frac{3\times(11 + 1)}{4}=9). So, (Q_3) is the 9th value in the ordered data set, which is (65).
Step7: Find the maximum
The maximum is the largest value, which is (97).
Answer:
The minimum of the data is (40). The first quartile is (43). The median of the data is (61). The third quartile is (65). The maximum of the data is (97).