3. model real life 26 people were asked about their favorite vacation spot. six chose amusement park. two…
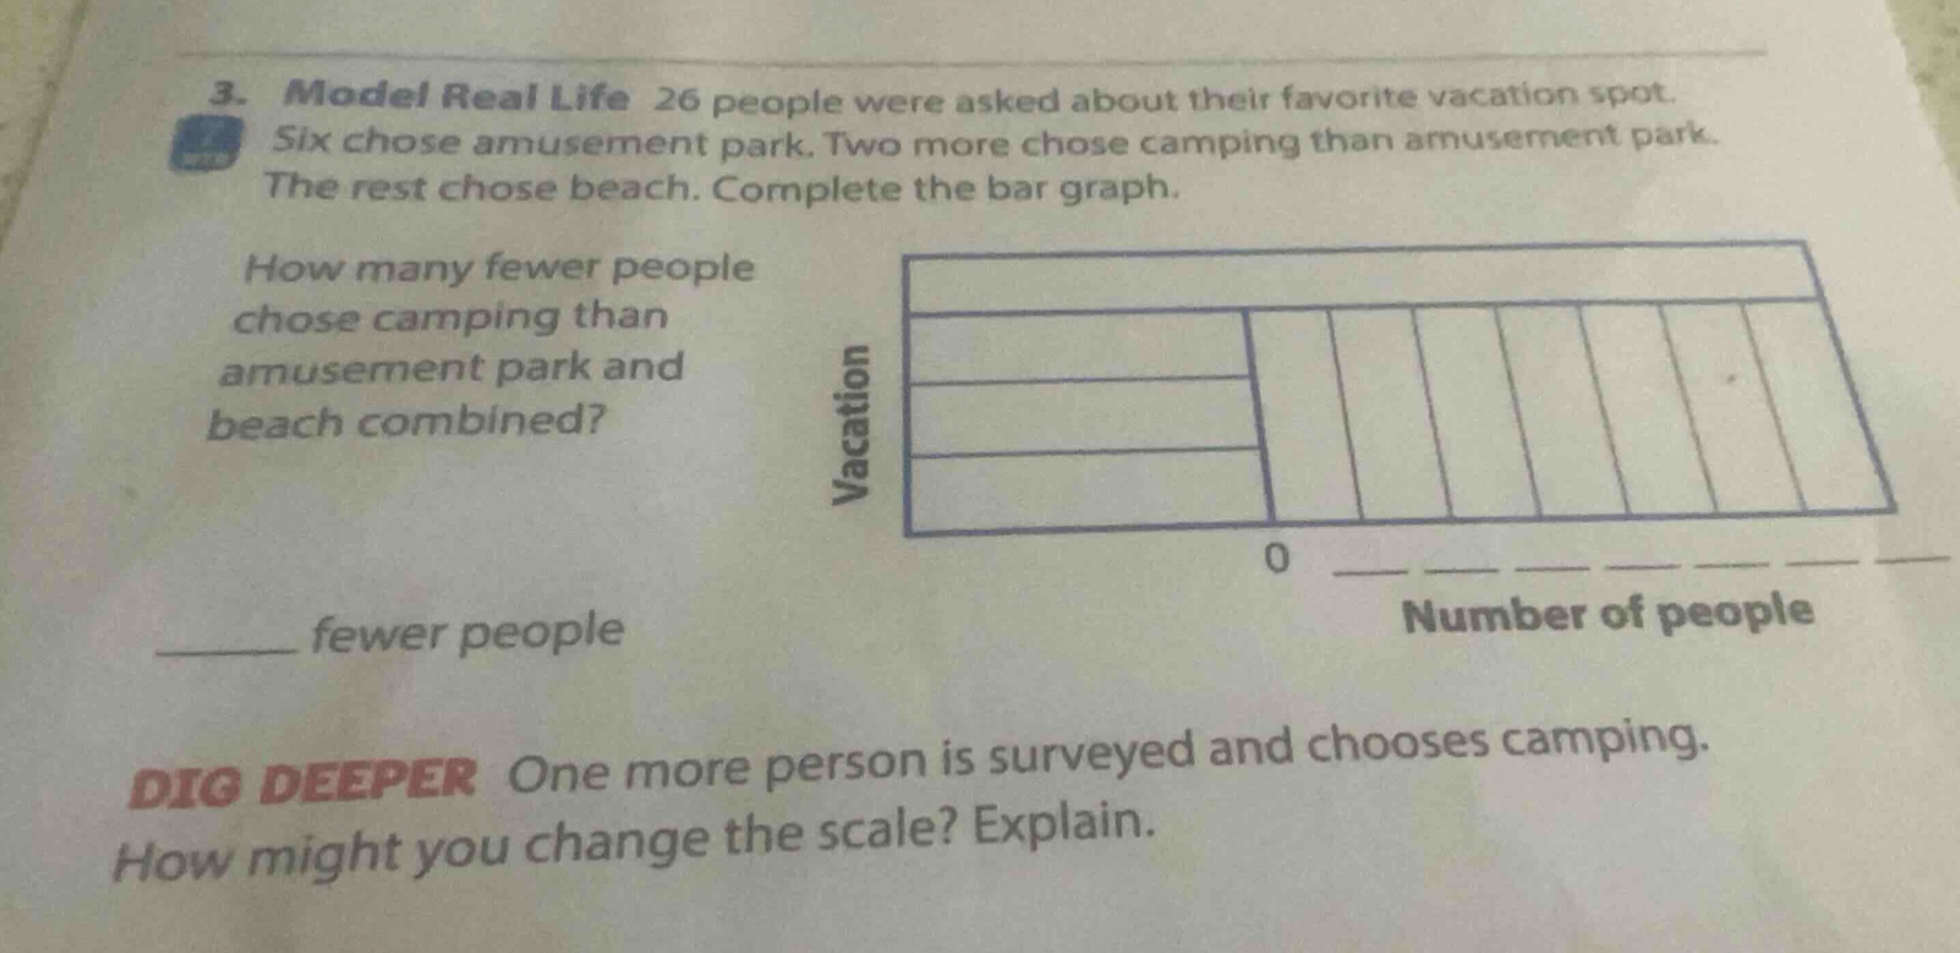
3. model real life 26 people were asked about their favorite vacation spot. six chose amusement park. two more chose camping than amusement park. the rest chose beach. complete the bar graph. how many fewer people chose camping than amusement park and beach combined? ____ fewer people dig deeper one more person is surveyed and chooses camping. how might you change the scale? explain.
Answer
Explanation:
Step1: Find number of camping - goers
Six chose amusement park and two more chose camping than amusement park. So number of people who chose camping is $6 + 2=8$.
Step2: Find number of beach - goers
Total 26 people were surveyed. Number of people who chose amusement park is 6 and camping is 8. So number of people who chose beach is $26-(6 + 8)=26 - 14 = 12$.
Step3: Calculate the difference
Number of people who chose amusement park and beach combined is $6+12 = 18$. Number of people who chose camping is 8. The difference is $18 - 8=10$.
Answer:
10
For the "DIG DEEPER" part:
Brief Explanations:
Currently, the number of people for each category ranges from 6 - 12. If one more person chooses camping, the new number of camping - goers is 9. To better represent the data on the bar - graph, if the current scale is in units of 1, we could change the scale to units of 2. This would make the graph less cluttered and still accurately represent the data as all the values (6, 9, 12) are divisible by 3 and can be easily represented with a scale of 2.
Answer:
We could change the scale to units of 2.