which modified box plot represents the data set? 10, 12, 2, 4, 24, 2, 7, 7, 9
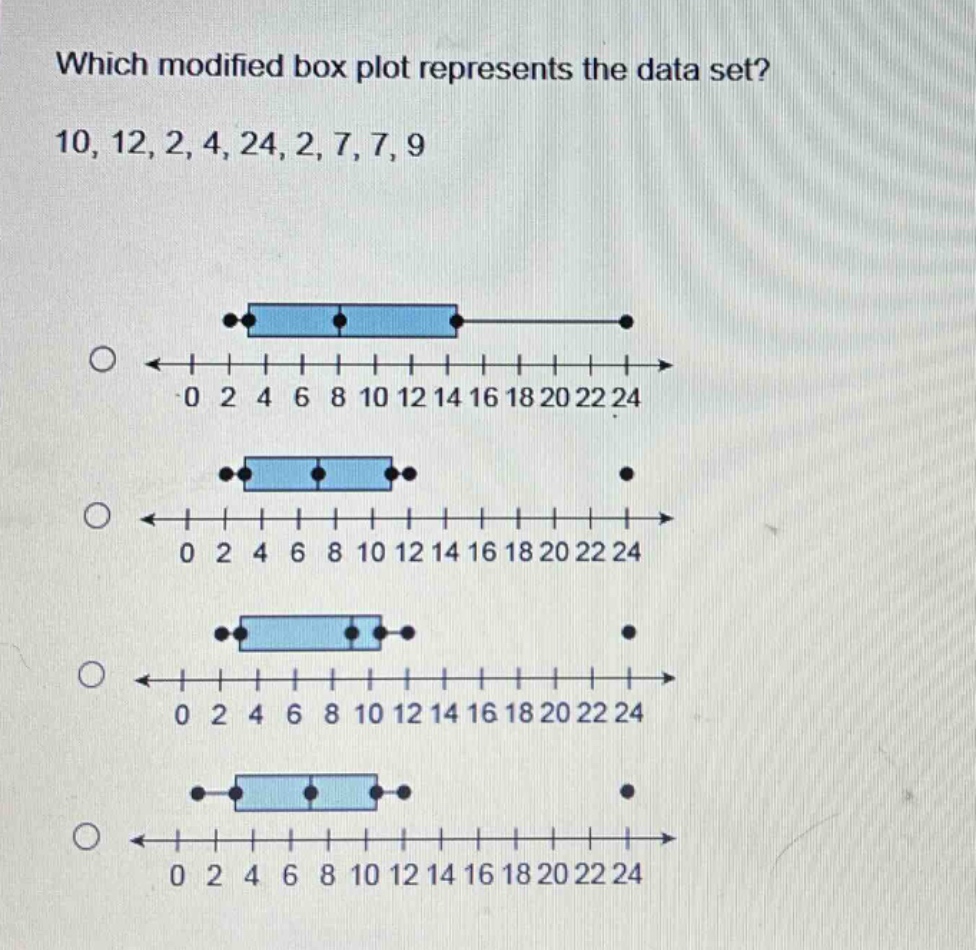
which modified box plot represents the data set? 10, 12, 2, 4, 24, 2, 7, 7, 9
Answer
Explanation:
Step1: Sort the data set
$2,2,4,7,7,9,10,12,24$
Step2: Find the median (Q2)
There are 9 data - points. The median is the 5th value. So, $Q2 = 7$.
Step3: Find the lower half of the data
The lower half is $2,2,4,7$. The median of the lower half (Q1) is $\frac{2 + 4}{2}=3$.
Step4: Find the upper half of the data
The upper half is $9,10,12,24$. The median of the upper half (Q3) is $\frac{10+12}{2} = 11$.
Step5: Calculate the inter - quartile range (IQR)
$IQR=Q3 - Q1=11 - 3 = 8$.
Step6: Find the lower and upper fences for outliers
Lower fence: $Q1-1.5\times IQR=3-1.5\times8=3 - 12=-9$ (no values below this in our data set). Upper fence: $Q3 + 1.5\times IQR=11+1.5\times8=11 + 12 = 23$. The value 24 is an outlier.
Step7: Analyze the box - plot
The box should have the left - hand side at Q1 = 3, the line inside the box at Q2 = 7, the right - hand side of the box at Q3 = 11, and a dot for the outlier at 24.
Answer:
The box - plot with the box having the left end at 3, the middle line at 7, the right end at 11, and a single outlier dot at 24. (You need to visually identify this among the given options).