which modified box plot represents the data set? 39, 39, 3, 40, 46, 48, 60, 62, 62
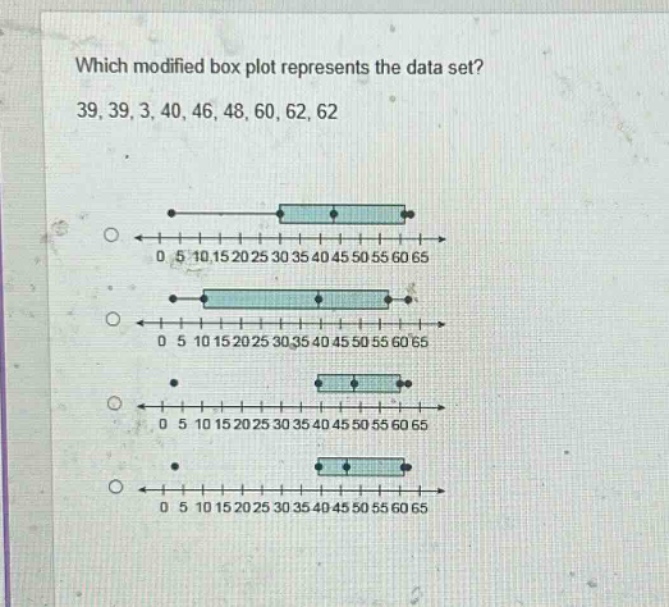
which modified box plot represents the data set? 39, 39, 3, 40, 46, 48, 60, 62, 62
Answer
Answer:
To determine the correct modified - box plot, we first need to find the five - number summary (minimum, first quartile $Q_1$, median, third quartile $Q_3$, maximum) of the data set (3,39,39,40,46,48,60,62,62).
-
Sort the data set: The data set is already sorted as (3,39,39,40,46,48,60,62,62).
- Minimum value: The minimum value of the data set is (3).
- Median ($Q_2$): Since there are (n = 9) data points, the median is the (\left(\frac{n + 1}{2}\right))-th value. So, (\frac{9+1}{2}=5) - th value. The median (Q_2=46).
- First quartile ($Q_1$): The lower half of the data set is (3,39,39,40). Since there are (n_1 = 4) data points in the lower - half, the first quartile is the average of the (\frac{4}{2})-th and (\left(\frac{4}{2}+1\right))-th values. The (\frac{4}{2}=2) - nd and (\frac{4}{2}+1 = 3) - rd values are (39) and (39), so (Q_1=\frac{39 + 39}{2}=39).
- Third quartile ($Q_3$): The upper half of the data set is (48,60,62,62). Since there are (n_2=4) data points in the upper - half, the third quartile is the average of the (\frac{4}{2})-th and (\left(\frac{4}{2}+1\right))-th values. The (\frac{4}{2}=2) - nd and (\frac{4}{2}+1 = 3) - rd values are (60) and (62), so (Q_3=\frac{60 + 62}{2}=61).
- Maximum value: The maximum value of the data set is (62).
-
Analyze the box - plot features:
- The box in a box - plot represents the inter - quartile range (IQR), where (IQR=Q_3 - Q_1=61 - 39 = 22). The left - hand side of the box is at (Q_1 = 39), the right - hand side of the box is at (Q_3=61), and the line inside the box is at the median (Q_2 = 46).
- The whiskers extend to the non - outlier minimum and maximum values. The minimum value is (3) which is an outlier (using the rule (Q_1-1.5\times IQR=39-1.5\times22=39 - 33 = 6), and (3<6)). So, the whisker will extend to the next non - outlier value in the lower half. The non - outlier minimum value in the lower half is (39). The maximum value (62) is not an outlier ((Q_3 + 1.5\times IQR=61+1.5\times22=61 + 33=94), and (62<94)).
The box - plot that has the left - hand side of the box at (39), the line inside the box at (46), the right - hand side of the box at (61), and the whisker on the left starting at (39) (because (3) is an outlier) and the whisker on the right at (62) is the correct one. Without seeing the exact visual details of each option, we can say that the box - plot with the following characteristics is correct:
- The box starts at (39), has a line at (46), and ends at (61).
- There is a point (outlier) at (3) and the left - hand whisker starts at (39) and the right - hand whisker ends at (62).
Explanation:
Step1: Sort the data set
(3,39,39,40,46,48,60,62,62)
Step2: Find the minimum
Minimum (=3)
Step3: Calculate the median
(n = 9), (\text{Median}=\text{5 - th value}=46)
Step4: Find the first quartile
Lower half: (3,39,39,40), (Q_1=\frac{39 + 39}{2}=39)
Step5: Find the third quartile
Upper half: (48,60,62,62), (Q_3=\frac{60+62}{2}=61)
Step6: Find the maximum
Maximum (=62)
Step7: Check for outliers
(Q_1-1.5\times IQR=39 - 33=6), (3<6) (outlier), (Q_3 + 1.5\times IQR=61+33 = 94), (62<94) (not outlier)