mona asked a sample of 10 kids in elementary school and 10 kids in middle school how many pieces of candy…
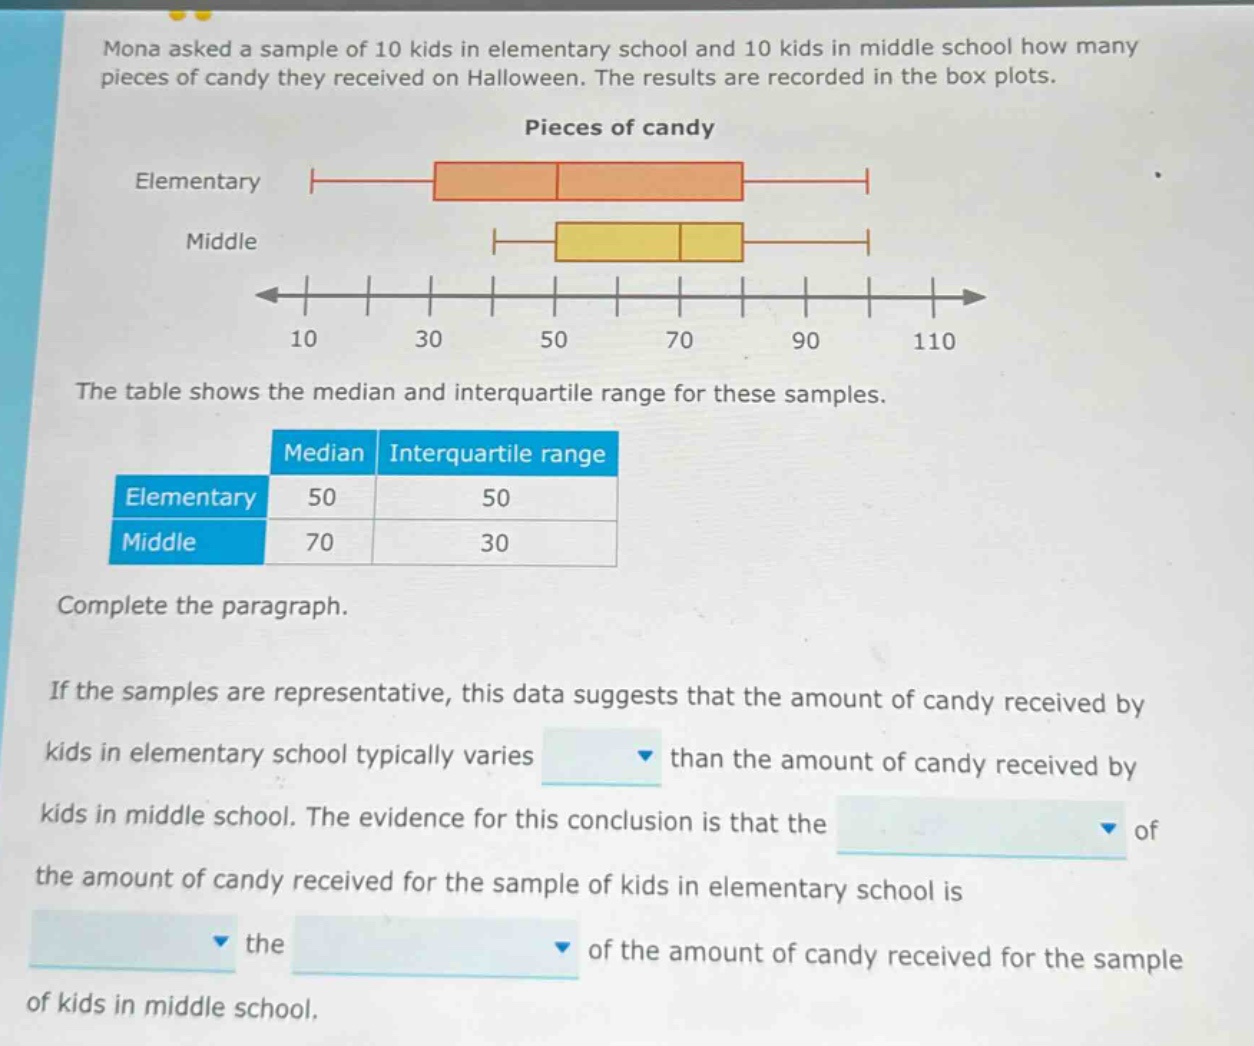
mona asked a sample of 10 kids in elementary school and 10 kids in middle school how many pieces of candy they received on halloween. the results are recorded in the box plots. pieces of candy elementary middle the table shows the median and interquartile range for these samples. median interquartile range elementary 50 50 middle 70 30 complete the paragraph. if the samples are representative, this data suggests that the amount of candy received by kids in elementary school typically varies than the amount of candy received by kids in middle school. the evidence for this conclusion is that the of the amount of candy received for the sample of kids in elementary school is the of the amount of candy received for the sample of kids in middle school.
Answer
Explanation:
Step1: Understand variability measure
Inter - quartile range (IQR) measures variability.
Step2: Compare IQRs
IQR for elementary is 50 and for middle is 30. Since 50>30.
Answer:
If the samples are representative, this data suggests that the amount of candy received by kids in elementary school typically varies more than the amount of candy received by kids in middle school. The evidence for this conclusion is that the inter - quartile range of the amount of candy received for the sample of kids in elementary school is greater than the inter - quartile range of the amount of candy received for the sample of kids in middle school.