month admiral autos countywide cars jan 4 9 feb 19 17 mar 15 14 apr 10 10 may 17 15 which statements are…
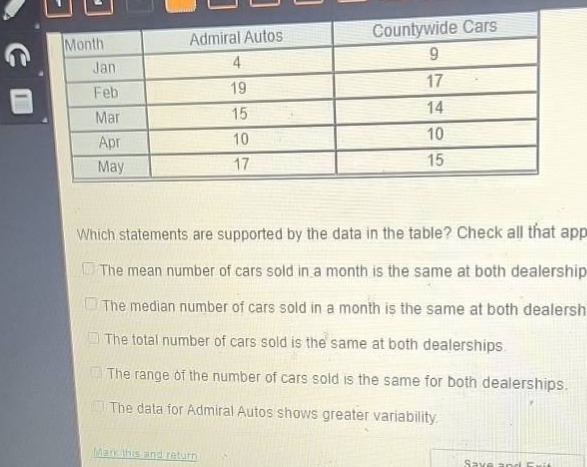
month admiral autos countywide cars jan 4 9 feb 19 17 mar 15 14 apr 10 10 may 17 15 which statements are supported by the data in the table? check all that apply. the mean number of cars sold in a month is the same at both dealerships. the median number of cars sold in a month is the same at both dealerships. the total number of cars sold is the same at both dealerships. the range of the number of cars sold is the same for both dealerships. the data for admiral autos shows greater variability.
Answer
Explanation:
Step1: Calculate mean for Admiral Autos
Mean = $\frac{4 + 19+15+10+17}{5}=\frac{65}{5}=13$
Step2: Calculate mean for Countywide Cars
Mean = $\frac{9 + 17+14+10+15}{5}=\frac{65}{5}=13$
Step3: Arrange Admiral Autos data in ascending - order: 4, 10, 15, 17, 19. Median is 15.
Arrange Countywide Cars data in ascending - order: 9, 10, 14, 15, 17. Median is 14.
Step4: Calculate total for Admiral Autos
Total = $4 + 19+15+10+17 = 65$
Step5: Calculate total for Countywide Cars
Total = $9 + 17+14+10+15 = 65$
Step6: Calculate range for Admiral Autos
Range = $19 - 4=15$
Step7: Calculate range for Countywide Cars
Range = $17 - 9 = 8$
Step8: Analyze variability
The range of Admiral Autos (15) is greater than the range of Countywide Cars (8), so Admiral Autos has greater variability.
Answer:
The mean number of cars sold in a month is the same at both dealerships. The total number of cars sold is the same at both dealerships. The data for Admiral Autos shows greater variability.