this month, the tinsville petting zoo is trying to determine how long guests stay when they visit the zoo…
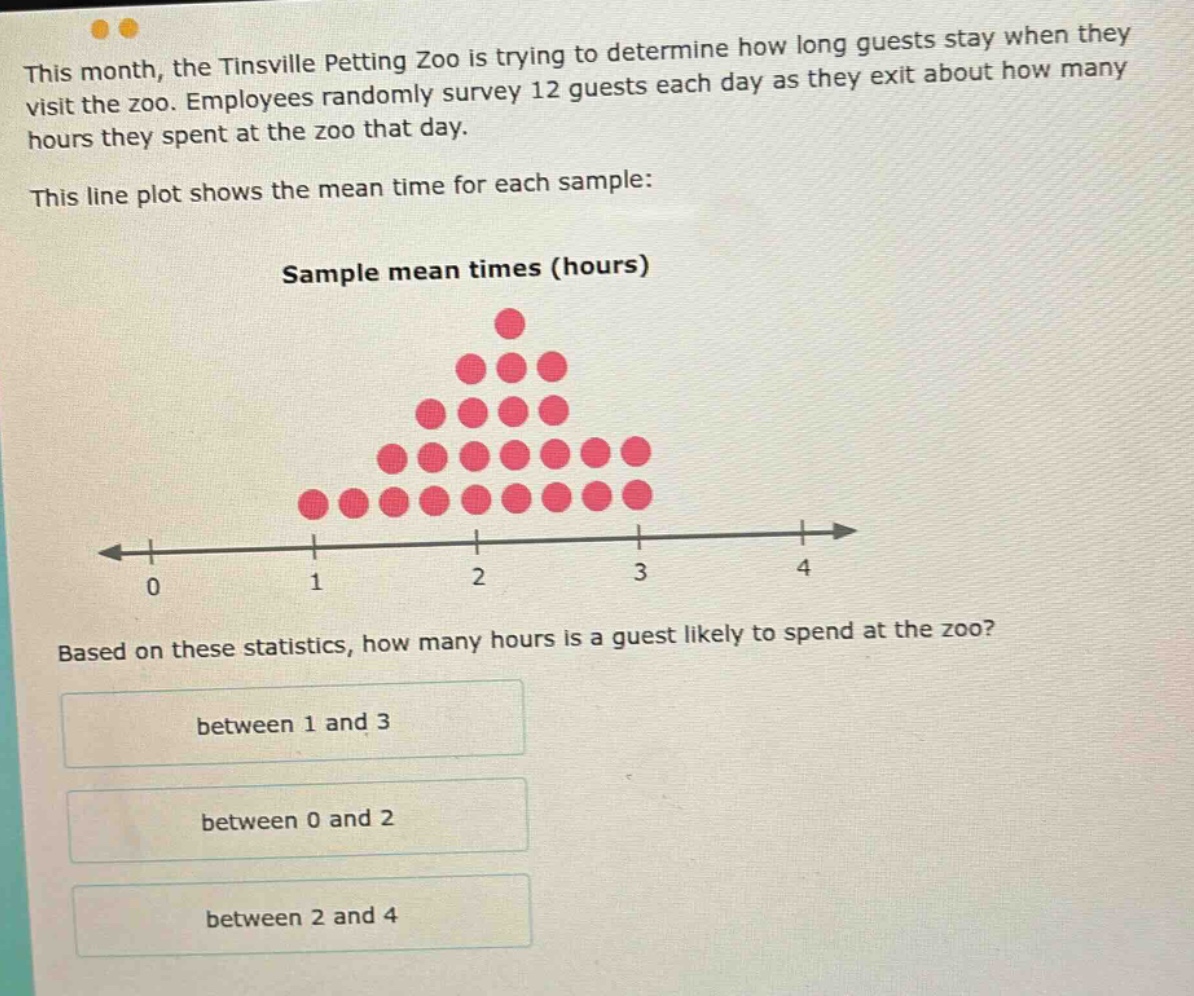
this month, the tinsville petting zoo is trying to determine how long guests stay when they visit the zoo. employees randomly survey 12 guests each day as they exit about how many hours they spent at the zoo that day. this line plot shows the mean time for each sample: sample mean times (hours) based on these statistics, how many hours is a guest likely to spend at the zoo? between 1 and 3 between 0 and 2 between 2 and 4
Answer
Explanation:
Step1: Analyze the line - plot
The line - plot shows the distribution of sample mean times. Most of the sample means are clustered between 1 and 3 on the number line.
Answer:
between 1 and 3