the mountain view ski resort kept track of the number of visitors they had each weekend during their busy…
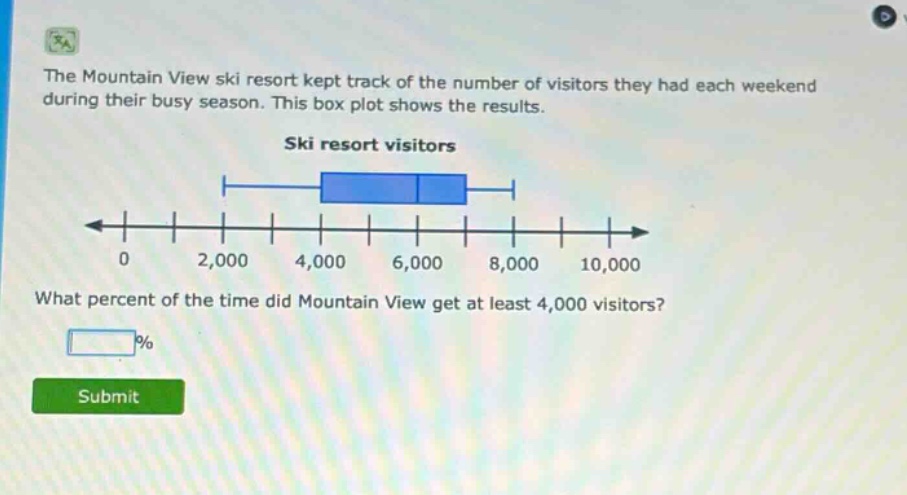
the mountain view ski resort kept track of the number of visitors they had each weekend during their busy season. this box plot shows the results. ski resort visitors what percent of the time did mountain view get at least 4,000 visitors? %
Answer
Explanation:
Step1: Understand box - plot quartiles
In a box - plot, the box represents the middle 50% of the data. The left - hand side of the box is the first quartile ($Q_1$) and the right - hand side is the third quartile ($Q_3$). The median is the line inside the box. The whiskers represent the rest of the data. Here, 4000 is the first quartile ($Q_1$).
Step2: Calculate the percentage
The first quartile divides the data such that 25% of the data is below it and 75% of the data is above it. Since we want to find the percentage of the time the resort got at least 4000 visitors (i.e., data above $Q_1$), we use the fact that $100 - 25=75$.
Answer:
75