the mountain view ski resort kept track of the number of visitors they had each weekend during their busy…
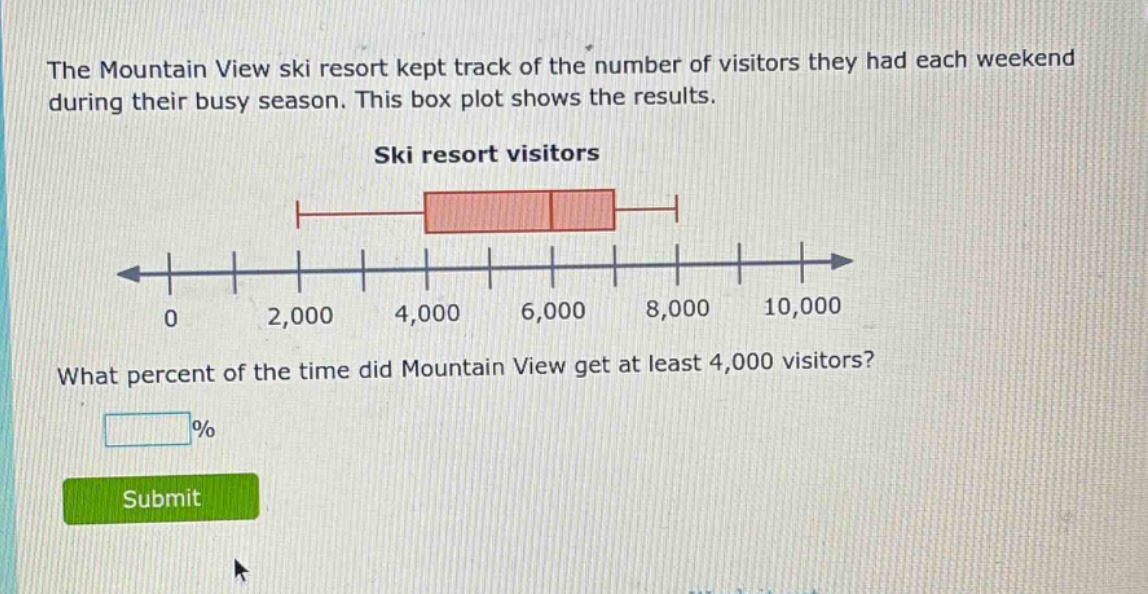
the mountain view ski resort kept track of the number of visitors they had each weekend during their busy season. this box plot shows the results. ski resort visitors what percent of the time did mountain view get at least 4,000 visitors? % submit
Answer
Explanation:
Step1: Recall box - plot properties
In a box - plot, the box represents the inter - quartile range (IQR), which contains 50% of the data. The lower whisker represents the lower 25% of the data and the upper whisker represents the upper 25% of the data. The value 4000 is the lower quartile ($Q_1$).
Step2: Calculate the percentage of data above 4000
The percentage of data above the lower quartile is 75%. Since 25% of the data is below the lower quartile and 100 - 25=75%.
Answer:
75