the movement of the progress bar may be uneven because questions can be worth more or less (including zero)…
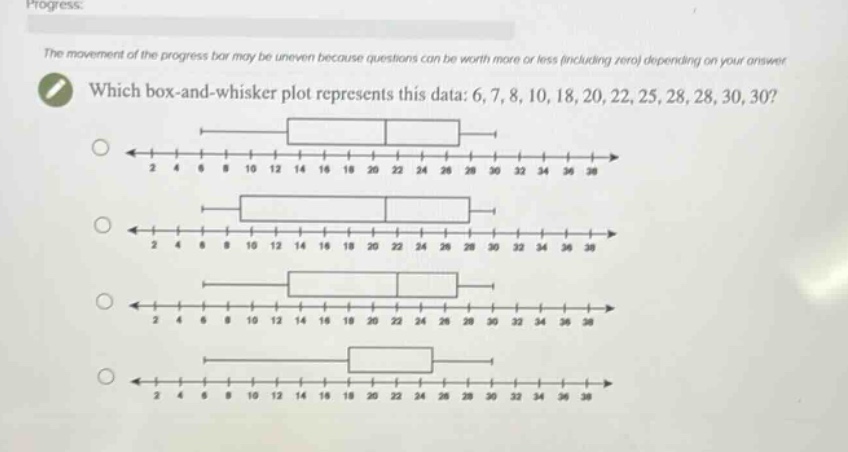
the movement of the progress bar may be uneven because questions can be worth more or less (including zero) depending on your answer. which box - and - whisker plot represents this data: 6, 7, 8, 10, 18, 20, 22, 25, 28, 28, 30, 30?
Answer
Explanation:
Step1: Arrange data in ascending - order
The data is already in ascending order: 6, 7, 8, 10, 18, 20, 22, 25, 28, 28, 30, 30.
Step2: Find the minimum value
The minimum value is 6.
Step3: Find the first - quartile ($Q_1$)
There are $n = 12$ data points. The position of $Q_1$ is $\frac{n + 1}{4}=\frac{12+1}{4}=3.25$. So, $Q_1=8+(0.25)\times(10 - 8)=8.5$.
Step4: Find the median ($Q_2$)
The position of the median is $\frac{n+1}{2}=\frac{12 + 1}{2}=6.5$. So, $Q_2=\frac{20 + 22}{2}=21$.
Step5: Find the third - quartile ($Q_3$)
The position of $Q_3$ is $\frac{3(n + 1)}{4}=\frac{3\times(12+1)}{4}=9.75$. So, $Q_3=28+(0.75)\times(28 - 28)=28$.
Step6: Find the maximum value
The maximum value is 30.
The box - and - whisker plot has a left - whisker starting at 6, the left side of the box at $Q_1 = 8.5$, the line inside the box at the median $Q_2=21$, the right side of the box at $Q_3 = 28$, and the right - whisker ending at 30.
Answer:
Without seeing the actual plots clearly, you need to look for a box - and - whisker plot where the left - most point (minimum) is at 6, the left side of the box is around 8.5, the line in the box is at 21, the right side of the box is at 28, and the right - most point (maximum) is at 30.