a movie theater is keeping data on the number of tickets sold and the price of a single ticket. which…
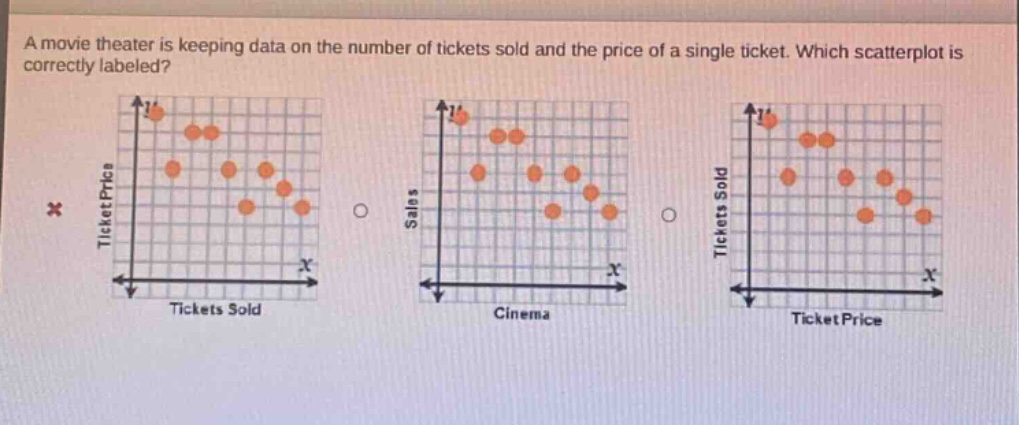
a movie theater is keeping data on the number of tickets sold and the price of a single ticket. which scatterplot is correctly labeled?
Answer
Brief Explanations:
The scatter - plot should have the two variables being studied on the axes. The variables are the number of tickets sold and the price of a single ticket. The first scatter - plot has "Ticket Price" on the y - axis and "Tickets Sold" on the x - axis, which correctly labels the two variables of interest. The second scatter - plot has "Sales" and "Cinema" as labels which are not the correct variables. The third scatter - plot has the variables reversed compared to what makes logical sense for this data (usually price is on the y - axis and quantity on the x - axis when looking at relationships in economics and data analysis).
Answer:
The first scatter - plot (with "Ticket Price" on the y - axis and "Tickets Sold" on the x - axis)