mr. blake asked the 60 students in his computer classes whether they prefer using a mouse or a touchpad…
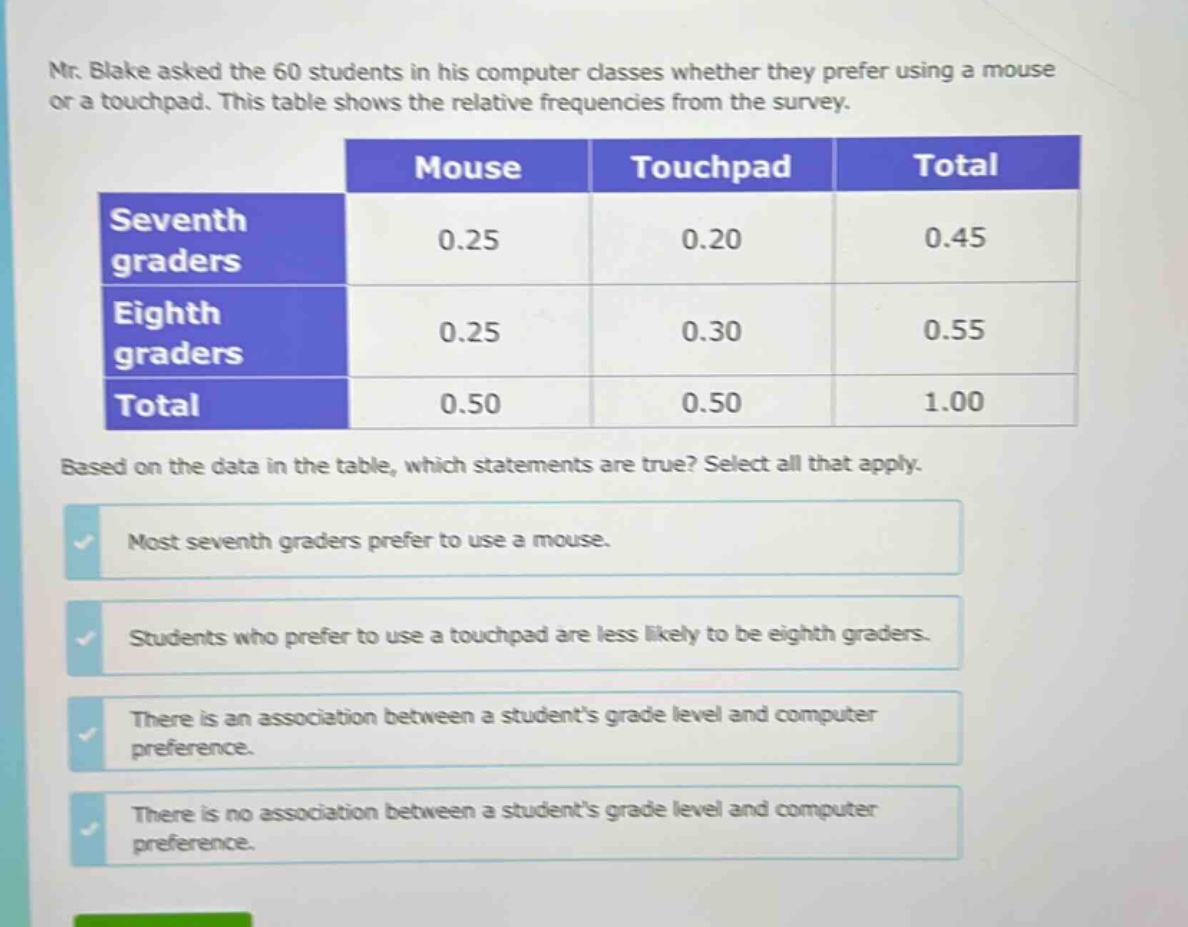
mr. blake asked the 60 students in his computer classes whether they prefer using a mouse or a touchpad. this table shows the relative frequencies from the survey.\n| |mouse|touchpad|total|\n|--|--|--|--|\n|seventh graders|0.25|0.20|0.45|\n|eighth graders|0.25|0.30|0.55|\n|total|0.50|0.50|1.00|\nbased on the data in the table, which statements are true? select all that apply.\nmost seventh graders prefer to use a mouse.\nstudents who prefer to use a touchpad are less likely to be eighth graders.\nthere is an association between a students grade level and computer preference.\nthere is no association between a students grade level and computer preference.
Answer
Explanation:
Step1: Analyze seventh - graders' preference
For seventh - graders, the relative frequency of preferring a mouse is 0.25 and for a touchpad is 0.20. Since 0.25>0.20, most seventh - graders prefer to use a mouse.
Step2: Analyze touchpad - users' grade level
The relative frequency of eighth - graders who prefer a touchpad is 0.30, and the total relative frequency of touchpad users is 0.50. The relative frequency of seventh - graders who prefer a touchpad is 0.20. Since 0.30 < 0.50, students who prefer to use a touchpad are not mostly eighth - graders, so they are less likely to be eighth - graders.
Step3: Check for association
If there was no association, the conditional relative frequencies (e.g., preference given grade level) would be the same as the marginal relative frequencies (e.g., overall preference). But for seventh - graders, the preference for mouse is 0.25 while overall preference for mouse is 0.50. So, there is an association between a student's grade level and computer preference.
Answer:
Most seventh graders prefer to use a mouse. Students who prefer to use a touchpad are less likely to be eighth graders. There is an association between a student's grade level and computer preference.