mr. cooks science classes practiced using an anemometer to measure wind speed. they recorded how fast the…
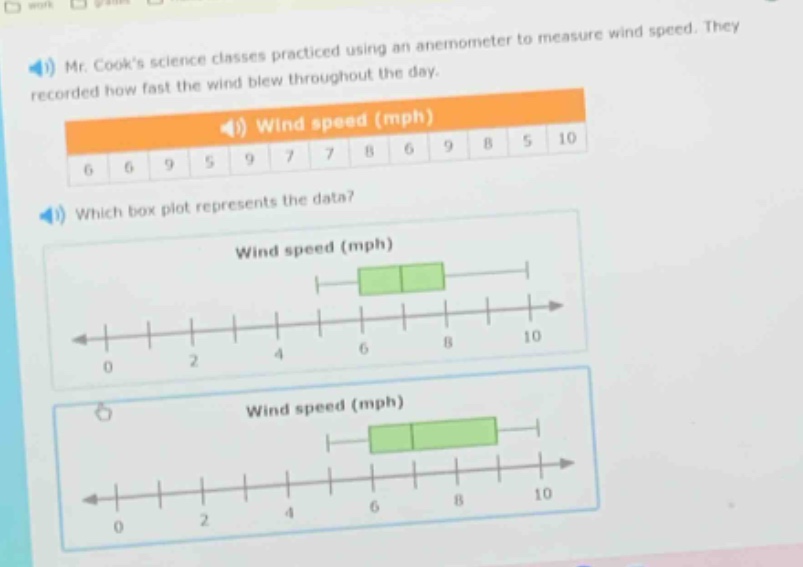
mr. cooks science classes practiced using an anemometer to measure wind speed. they recorded how fast the wind blew throughout the day. wind speed (mph) 6 6 9 5 9 7 7 8 6 9 8 5 10 which box - plot represents the data? wind speed (mph) wind speed (mph)
Answer
Explanation:
Step1: Arrange data in ascending order
5, 5, 6, 6, 6, 7, 7, 8, 8, 9, 9, 9, 10
Step2: Find the median (Q2)
There are 13 data - points. The median is the 7th value. So, Q2 = 7.
Step3: Find the lower half of data
5, 5, 6, 6, 6, 7. The median of the lower half (Q1) is the 3rd value, Q1 = 6.
Step4: Find the upper half of data
8, 8, 9, 9, 9, 10. The median of the upper half (Q3) is the 3rd value of this half, Q3 = 9.
Step5: Identify the minimum and maximum
The minimum value is 5 and the maximum value is 10.
The box - plot should have the left - hand side of the box at Q1 = 6, the line inside the box at Q2 = 7, the right - hand side of the box at Q3 = 9, the left - hand whisker starting at 5 and the right - hand whisker ending at 10.
Answer:
The box - plot with the left - hand side of the box at 6, the line inside the box at 7, the right - hand side of the box at 9, the left - hand whisker starting at 5 and the right - hand whisker ending at 10.