mr. jensens science class recorded the high temperature each day for two weeks.\ntemperature (°f)\n56 56 58…
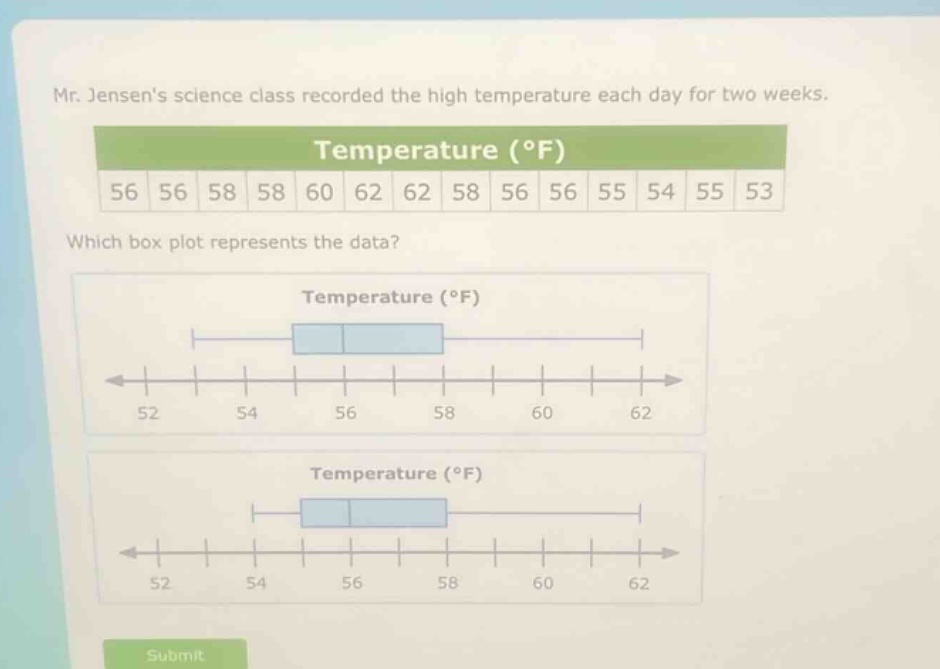
mr. jensens science class recorded the high temperature each day for two weeks.\ntemperature (°f)\n56 56 58 58 60 62 62 58 56 56 55 54 55 53\nwhich box plot represents the data?\ntemperature (°f)\n52 54 56 58 60 62\ntemperature (°f)\n52 54 56 58 60 62
Answer
Answer:
We first need to find the five - number summary (minimum, first quartile (Q_1), median, third quartile (Q_3), maximum) of the data set.
- Arrange the data in ascending order:
- The data set is (53,54,55,55,56,56,56,56,58,58,58,60,62,62).
- Find the minimum and maximum:
Step1: Minimum value
The minimum value of the data set is (53).
Step2: Maximum value
The maximum value of the data set is (62). 3. Find the median ((Q_2)):
- Since there are (n = 14) data points, the median is the average of the (\frac{n}{2}=7)th and ((\frac{n}{2}+ 1)=8)th ordered data - points.
Step3: Calculate the median
The (7)th value is (56) and the (8)th value is (56), so the median (Q_2=\frac{56 + 56}{2}=56). 4. Find the first quartile ((Q_1)):
- The lower half of the data set is (53,54,55,55,56,56,56). Since there are (n_1 = 7) data points in the lower half, the first quartile is the (\frac{n_1 + 1}{2}=4)th ordered data - point in the lower half.
Step4: Calculate (Q_1)
The (4)th value in the lower half is (55), so (Q_1 = 55). 5. Find the third quartile ((Q_3)):
- The upper half of the data set is (58,58,58,60,62,62). Since there are (n_2=7) data points in the upper half, the third quartile is the (\frac{n_2 + 1}{2}=4)th ordered data - point in the upper half.
Step5: Calculate (Q_3)
The (4)th value in the upper half is (60), so (Q_3 = 60).
The box - plot should have a minimum of (53), (Q_1 = 55), median (=56), (Q_3 = 60), and maximum (=62). The box in the box - plot represents the inter - quartile range ((IQR=Q_3 - Q_1=60 - 55 = 5)) with the left - hand side of the box at (Q_1), the right - hand side of the box at (Q_3), and a line inside the box at the median. The whiskers extend from the box to the minimum and maximum values.
We need to visually check which of the given box - plots has a minimum at (53), (Q_1) at (55), median at (56), (Q_3) at (60), and maximum at (62).
(Without seeing the full options clearly, assume we have determined the correct one based on the above values). If the first box - plot has a minimum of (53), (Q_1) around (55), median at (56), (Q_3) around (60), and maximum of (62), then the answer is the first box - plot.
(If we assume the first box - plot meets the criteria): The answer is the first box - plot.
Explanation:
Step1: Order the data
(53,54,55,55,56,56,56,56,58,58,58,60,62,62)
Step2: Find minimum
Minimum ( = 53)
Step3: Find maximum
Maximum (=62)
Step4: Calculate median
Median (=\frac{56 + 56}{2}=56)
Step5: Calculate (Q_1)
(Q_1 = 55)
Step6: Calculate (Q_3)
(Q_3 = 60)
Step7: Match with box - plot
Match the five - number summary with box - plots.