mr. larson, a math teacher, assigned his students a project to do in pairs. he recorded the grade each pair…
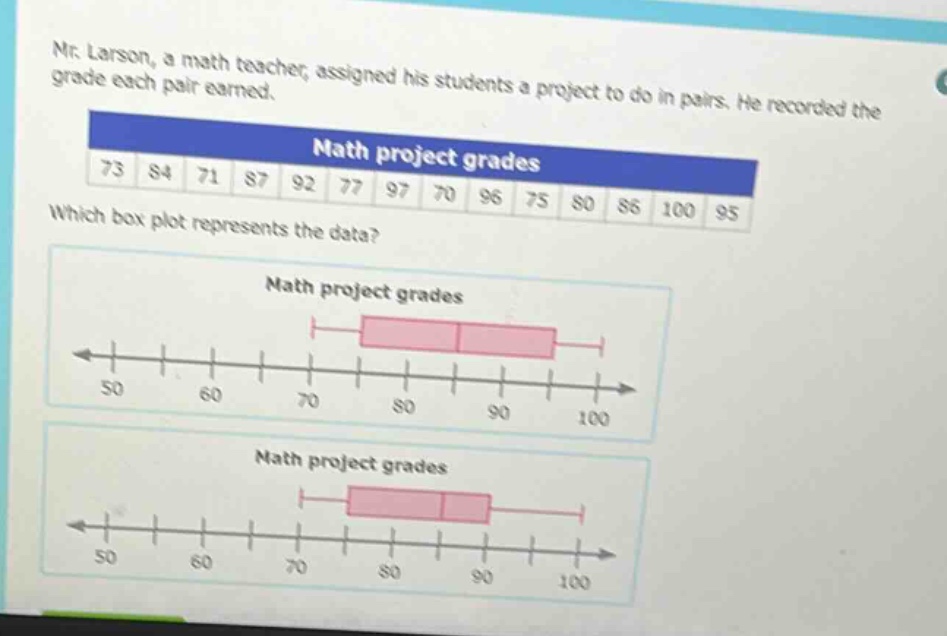
mr. larson, a math teacher, assigned his students a project to do in pairs. he recorded the grade each pair earned.\nmath project grades\n73 84 71 87 92 77 97 70 96 75 80 86 100 95\nwhich box plot represents the data?\nmath project grades\nmath project grades
Answer
Explanation:
Step1: Arrange data in ascending order
70, 71, 73, 75, 77, 80, 84, 86, 87, 92, 95, 96, 97, 100
Step2: Find the minimum value
The minimum value is 70.
Step3: Find the first - quartile (Q1)
There are 14 data points. The position of Q1 is $\frac{14 + 1}{4}=3.75$. So, Q1 is $73+(75 - 73)\times0.75 = 74.5$.
Step4: Find the median (Q2)
The position of the median is $\frac{14}{2}=7$. The median is the average of the 7th and 8th ordered data points, $\frac{84 + 86}{2}=85$.
Step5: Find the third - quartile (Q3)
The position of Q3 is $3\times\frac{14 + 1}{4}=11.25$. So, Q3 is $95+(96 - 95)\times0.25 = 95.25$.
Step6: Find the maximum value
The maximum value is 100.
We need to check which box - plot has a minimum of 70, Q1 around 74.5, median of 85, Q3 around 95.25 and maximum of 100.
Answer:
We cannot determine the answer without seeing the full set of box - plot options, but the correct box - plot should have the minimum at 70, Q1 at approximately 74.5, median at 85, Q3 at approximately 95.25 and maximum at 100.