mr. li records the measures of the lengths of his students handprints. the lengths, in centimeters, are…
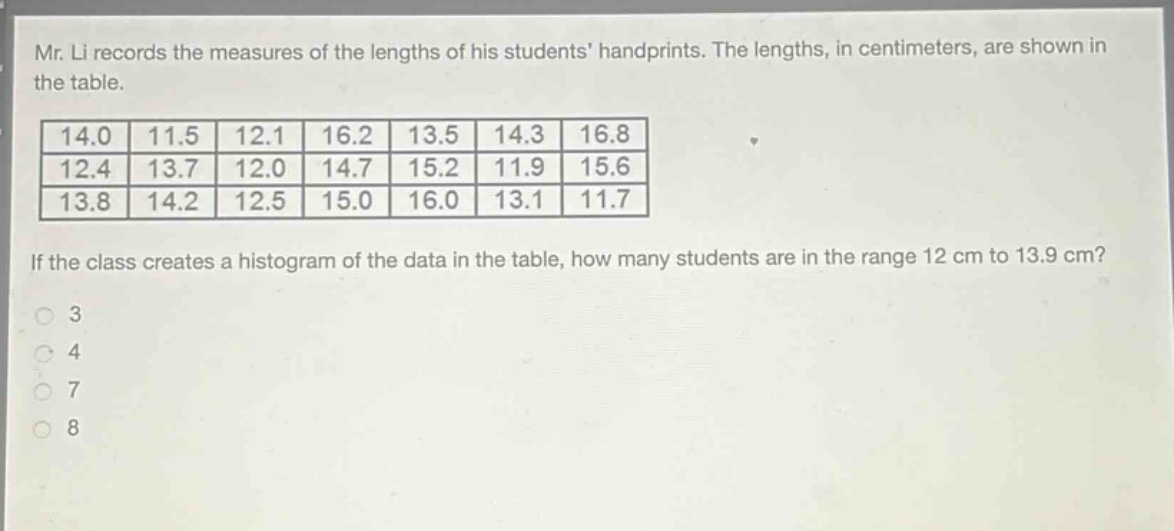
mr. li records the measures of the lengths of his students handprints. the lengths, in centimeters, are shown in the table.\n14.0 11.5 12.1 16.2 13.5 14.3 16.8\n12.4 13.7 12.0 14.7 15.2 11.9 15.6\n13.8 14.2 12.5 15.0 16.0 13.1 11.7\nif the class creates a histogram of the data in the table, how many students are in the range 12 cm to 13.9 cm?\n3\n4\n7\n8
Answer
Explanation:
Step1: Identify the data points
The data points representing the lengths of students' handprints in centimeters are: 14.0, 11.5, 12.1, 16.2, 13.5, 14.3, 16.8, 12.4, 13.7, 12.0, 14.7, 15.2, 11.9, 15.6, 13.8, 14.2, 12.5, 15.0, 16.0, 13.1, 11.7
Step2: Define the required range
We need to count the number of students whose handprint lengths fall within the range $12$ cm to $13.9$ cm, inclusive. This corresponds to the interval $[12.0, 13.9]$.
Step3: Count data points within the range
Identify the data points from the list that are greater than or equal to $12.0$ and less than or equal to $13.9$. The values are: $12.1, 13.5, 12.4, 13.7, 12.0, 13.8, 12.5, 13.1$.
Step4: Determine the total count
Count the number of values identified in Step 3. There are $8$ values in the specified range.
Answer:
8