mr. lowe is a school librarian. his computer kept track of the number of books checked out each month during…
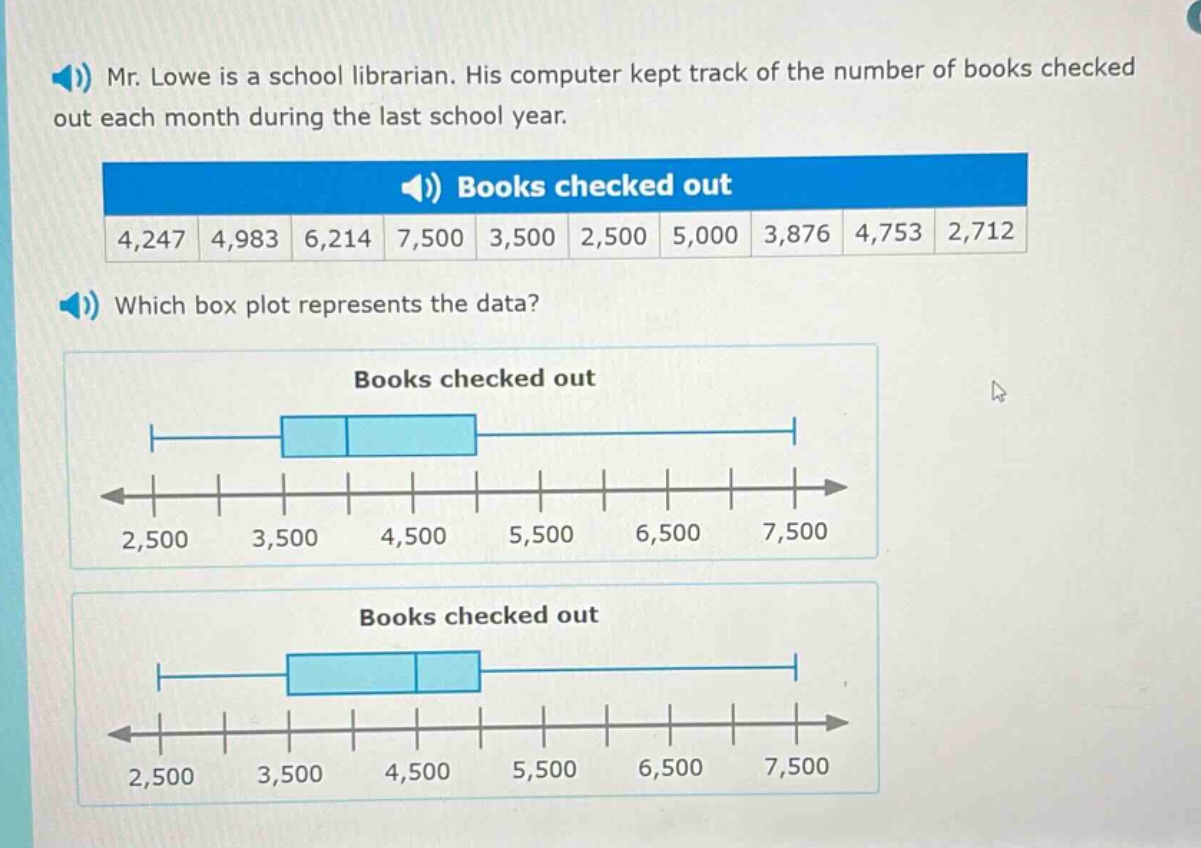
mr. lowe is a school librarian. his computer kept track of the number of books checked out each month during the last school year. books checked out 4,247 4,983 6,214 7,500 3,500 2,500 5,000 3,876 4,753 2,712 which box plot represents the data? books checked out 2,500 3,500 4,500 5,500 6,500 7,500 books checked out 2,500 3,500 4,500 5,500 6,500 7,500
Answer
Explanation:
Step1: Arrange data in ascending order
2,500, 2,712, 3,500, 3,876, 4,247, 4,753, 4,983, 5,000, 6,214, 7,500
Step2: Find the median (Q2)
Since there are 10 data - points, the median is the average of the 5th and 6th values. $\frac{4247 + 4753}{2}=4500$
Step3: Find the lower half of data
2,500, 2,712, 3,500, 3,876, 4,247. The median of the lower half (Q1) is 3,500.
Step4: Find the upper half of data
4,753, 4,983, 5,000, 6,214, 7,500. The median of the upper half (Q3) is 5,000.
Step5: Identify the minimum and maximum
The minimum is 2,500 and the maximum is 7,500.
The box - plot should have the minimum at 2,500, Q1 at 3,500, Q2 at 4,500, Q3 at 5,000, and the maximum at 7,500.
Answer:
The box - plot with the minimum at 2,500, the left - hand side of the box at 3,500, the line inside the box at 4,500, the right - hand side of the box at 5,000, and the maximum at 7,500. (Without seeing the full options, we describe the correct characteristics. If there are only two options as shown in the image, we would need to visually check which one has these values marked correctly on the box - plot).