mr. lowe is a school librarian. his computer kept track of the number of books checked out each month during…
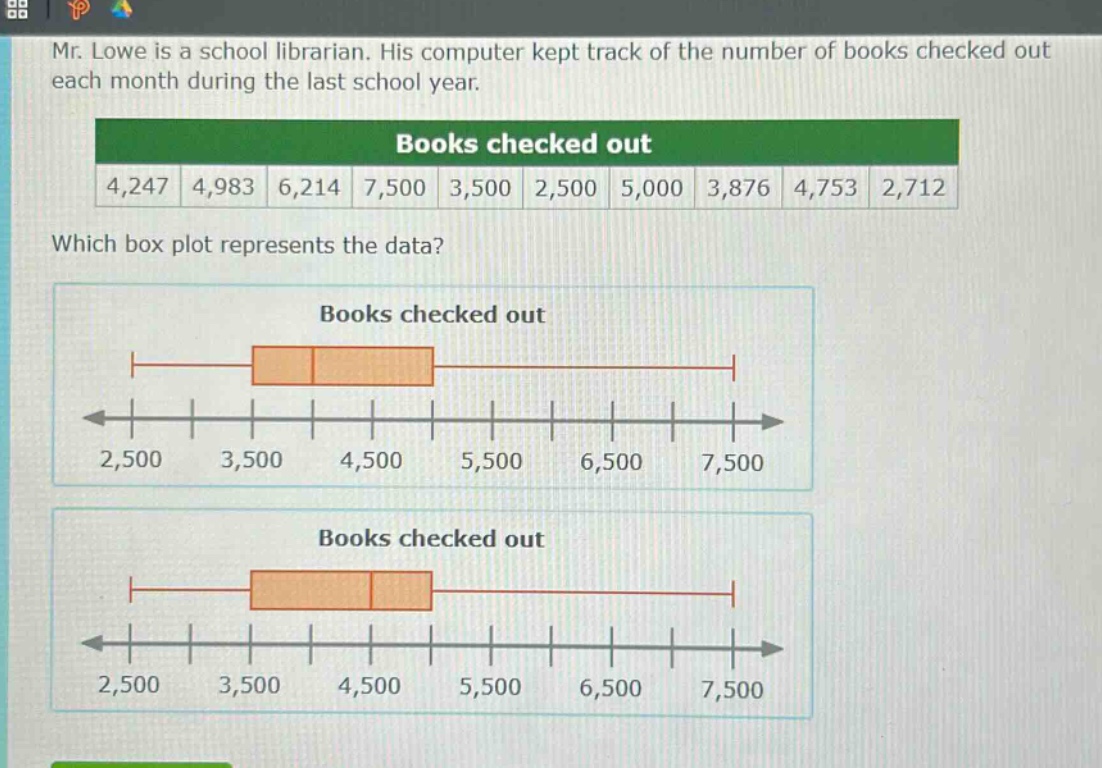
mr. lowe is a school librarian. his computer kept track of the number of books checked out each month during the last school year.\nbooks checked out\n4,247 4,983 6,214 7,500 3,500 2,500 5,000 3,876 4,753 2,712\nwhich box plot represents the data?\nbooks checked out\n2,500 3,500 4,500 5,500 6,500 7,500\nbooks checked out\n2,500 3,500 4,500 5,500 6,500 7,500
Answer
Explanation:
Step1: Arrange data in ascending order
$2,500,2,712,3,500,3,876,4,247,4,753,4,983,5,000,6,214,7,500$
Step2: Find the minimum value
The minimum value is $2,500$.
Step3: Find the first - quartile ($Q_1$)
There are $n = 10$ data points. The position of $Q_1$ is $\frac{n + 1}{4}=\frac{10+1}{4}=2.75$. So, $Q_1=3,500$.
Step4: Find the median ($Q_2$)
The position of the median is $\frac{n+1}{2}=\frac{10 + 1}{2}=5.5$. So, $Q_2=\frac{4,247+4,753}{2}=4,500$.
Step5: Find the third - quartile ($Q_3$)
The position of $Q_3$ is $\frac{3(n + 1)}{4}=\frac{3\times(10 + 1)}{4}=8.25$. So, $Q_3=5,000$.
Step6: Find the maximum value
The maximum value is $7,500$.
The box - plot should have the minimum value at $2,500$, $Q_1$ at $3,500$, $Q_2$ at $4,500$, $Q_3$ at $5,000$ and the maximum value at $7,500$.
Answer:
The box - plot with the minimum value at $2,500$, the left - hand side of the box at $3,500$, the line inside the box at $4,500$, the right - hand side of the box at $5,000$ and the maximum value at $7,500$ represents the data. (Since no specific labels for the two box - plots are given, a description based on the calculated values is provided).